. 2008 Nov;32(2):229-42.
doi: 10.1016/j.nbd.2008.06.018. Epub 2008 Jul 11.

The synaptic impact of the host immune response in a parkinsonian allograft rat model: Influence on graft-derived aberrant behaviors

Affiliations

The synaptic impact of the host immune response in a parkinsonian allograft rat model: Influence on graft-derived aberrant behaviors

K E Soderstrom et al. Neurobiol Dis. 2008 Nov.

Abstract

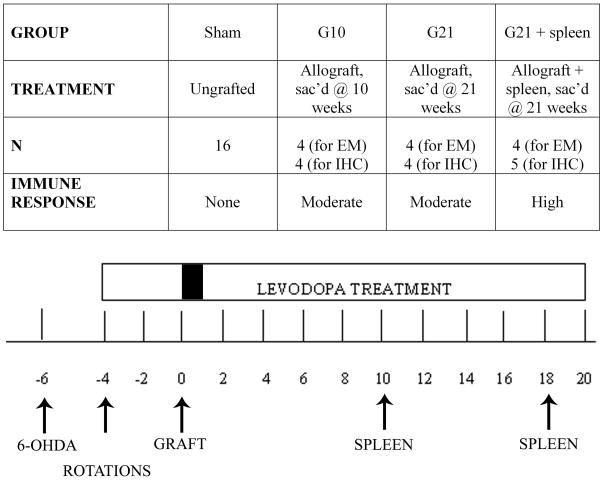
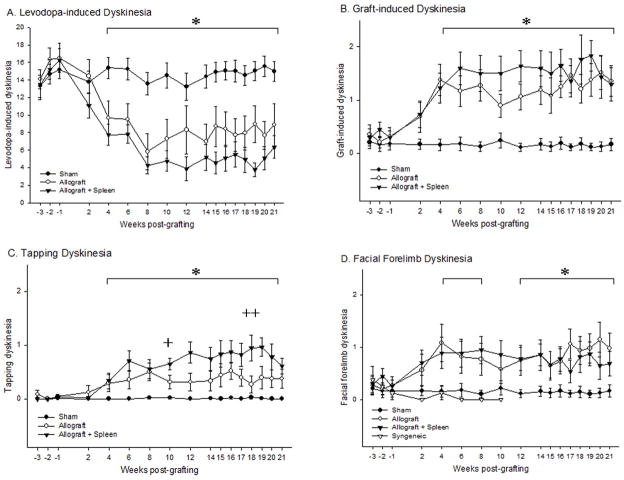
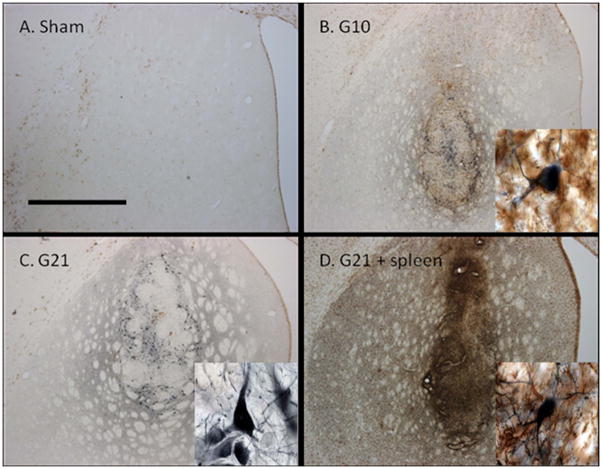
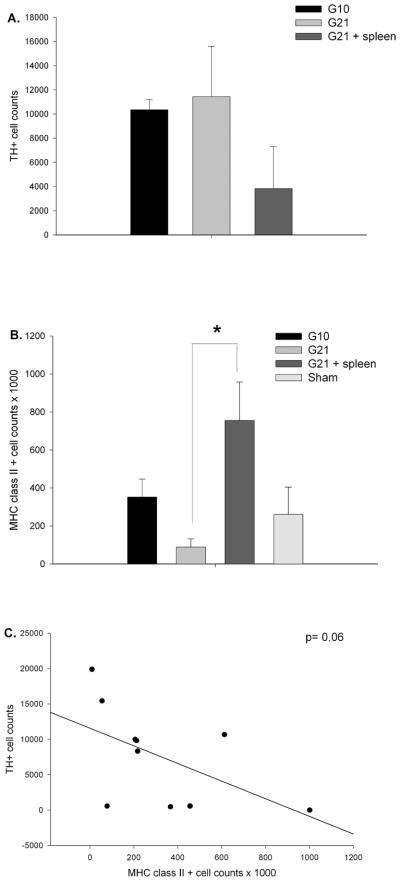
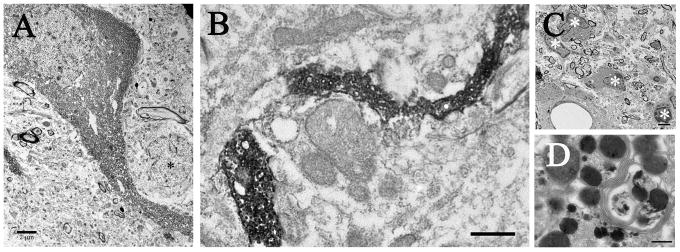
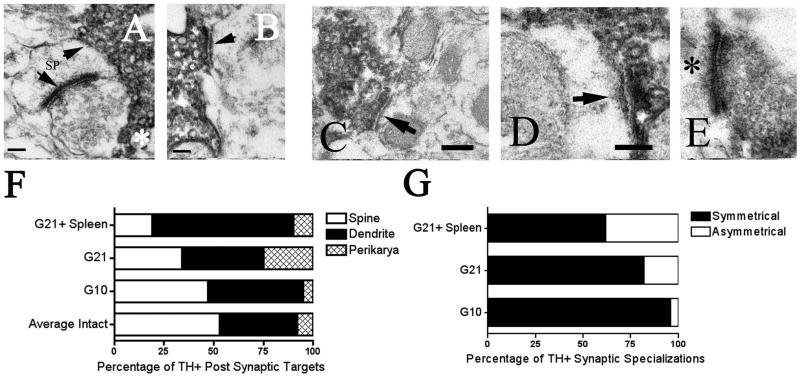
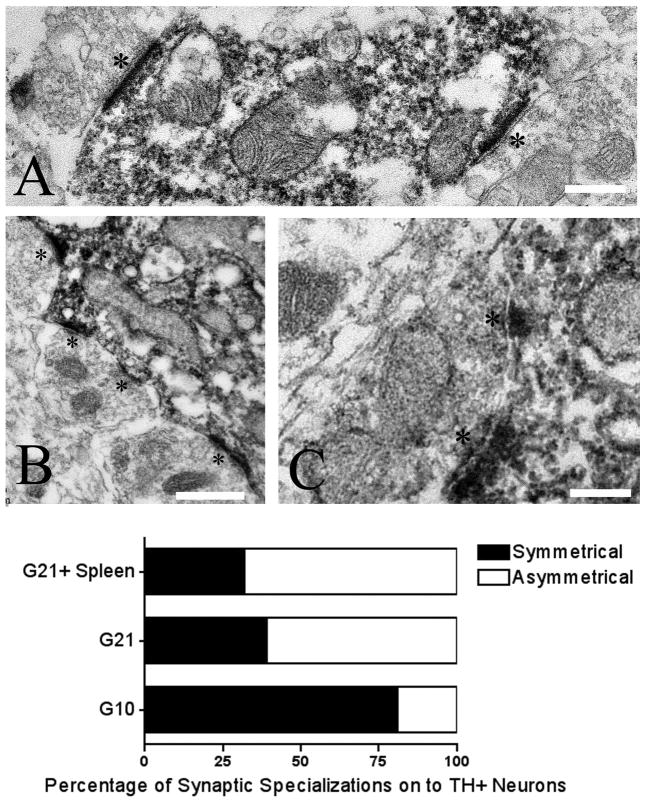
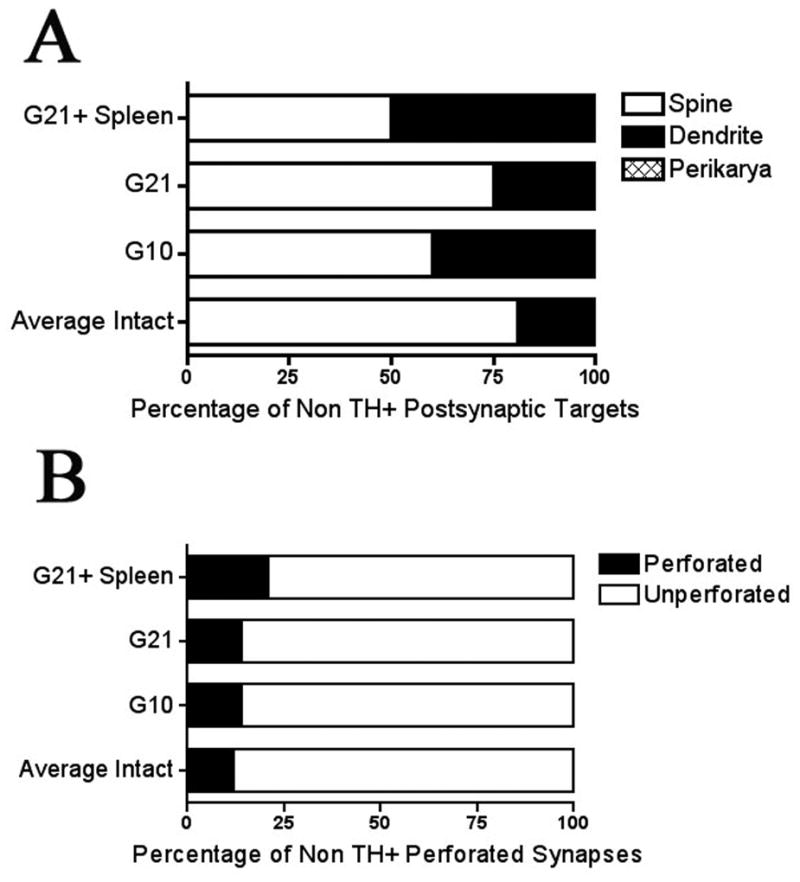
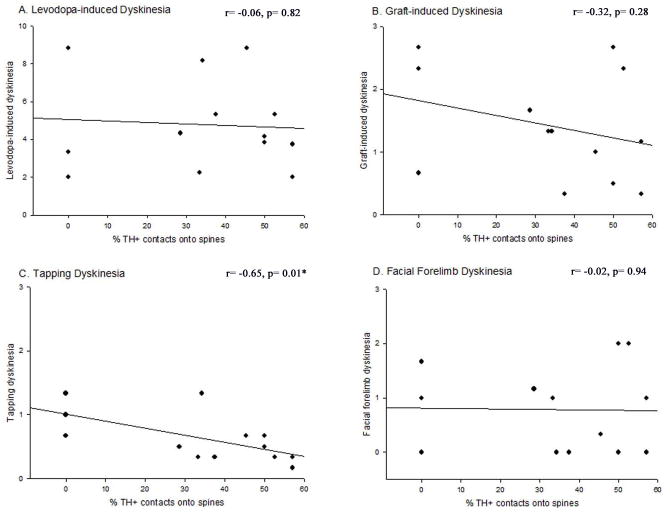
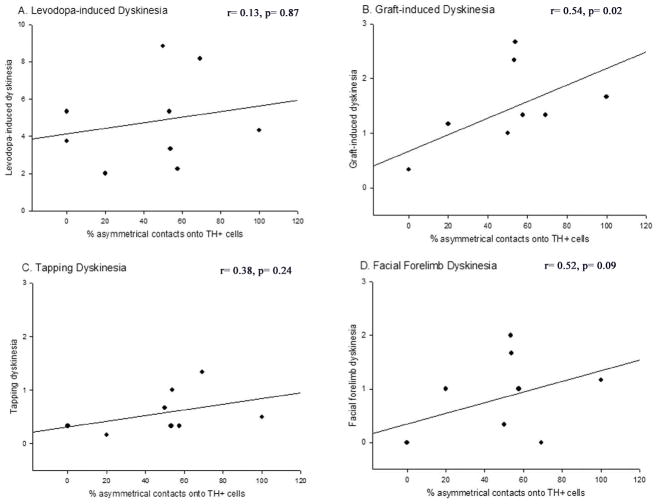
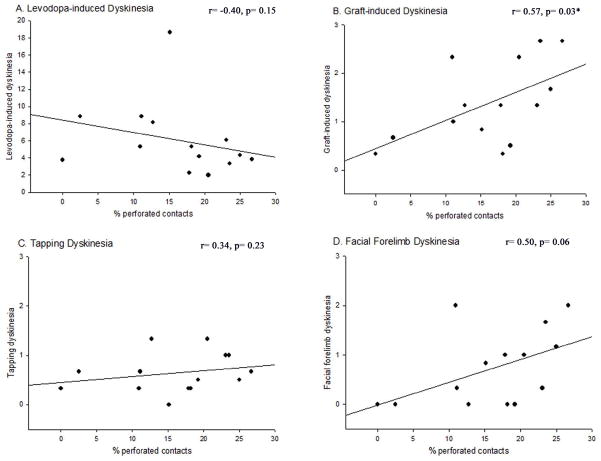
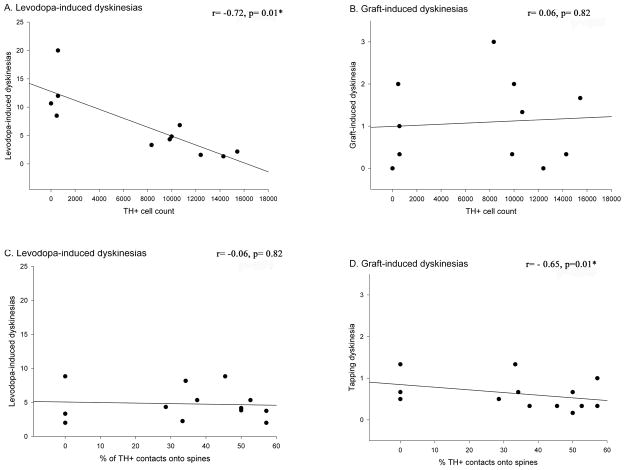
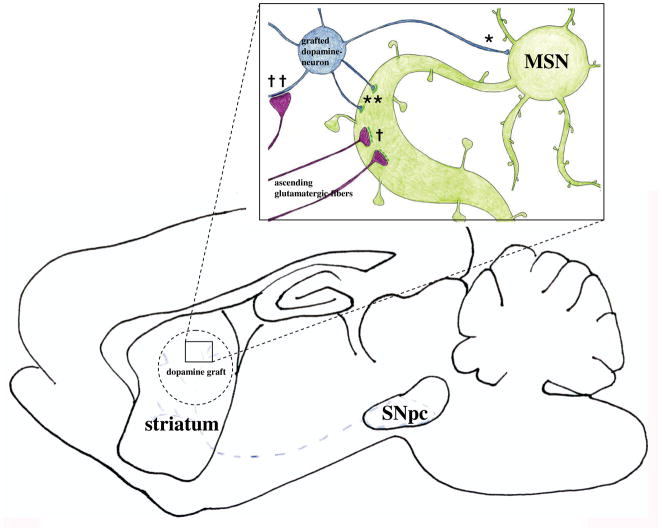
Graft-induced dyskinesias (GIDs), side-effects found in clinical grafting trials for Parkinson's disease (PD), may be associated with the withdrawal of immunosuppression. The goal of this study was to determine the role of the immune response in GIDs. We examined levodopa-induced dyskinesias (LIDs), GID-like behaviors, and synaptic ultrastructure in levodopa-treated, grafted, parkinsonian rats with mild (sham), moderate (allografts) or high (allografts plus peripheral spleen cell injections) immune activation. Grafts attenuated amphetamine-induced rotations and LIDs, but two abnormal motor syndromes (tapping stereotypy, litter retrieval/chewing) emerged and increased with escalating immune activation. Immunohistochemical analyses confirmed immune activation and graft survival. Ultrastructural analyses showed increases in tyrosine hydroxylase-positive (TH+) axo-dendritic synapses, TH+ asymmetric specializations, and non-TH+ perforated synapses in grafted, compared to intact, striata. These features were exacerbated in rats with the highest immune activation and correlated statistically with GID-like behaviors, suggesting that immune-mediated aberrant synaptology may contribute to graft-induced aberrant behaviors.


Figures

Figure 1
Figure 1. Experimental Groups and Timeline
Rats were placed into 3 treatment groups; sham group (ungrafted), allografted group sacrificed at 21 weeks (G21), and allografted group receiving peripheral spleen cells injections (G21 + spleen) sacrificed at 21 weeks. An additional cohort of rats (N=8) was sacrificed at a 10-week post-graft time point to serve for mid-point (pre-spleen) assessment of graft and immune cell integrity. All rats received unilateral nigrostriatal 6-OHDA lesions, which were confirmed 2 weeks later with amphetamine-induced rotational testing. Rats were primed with levodopa 4 weeks prior to neural grafting (one week of a priming dose of 25mg/kg levodopa, 25mg/kg benserazide, followed by 3 weeks of 12.5 mg/kg levodopa, 12.5mg/kg benserazide; once daily, 5 days a week). Rats were grafted 6 weeks following 6-OHDA. Levodopa treatment was withheld from all rats for one week post-grafting followed by weekly delivery of 12.5mg/kg levodopa, 12.5mg/kg benserazide once daily, 5 days a week for the remainder of the experiment. G21 + spleen treated rats received peripheral, subcutaneous spleen cell injections on weeks 10 and 18 post-grafting.
Figure 2
Figure 2. Levodopa and Graft-induced Dyskinetic Behavioral Profiles
(A) Levodopa-induced dyskinesias (LIDs) for all groups over 21 weeks. A significant difference was seen between both allografted groups and the sham group by week 4 post-grafting (*p<0.05). Rats receiving peripheral spleen cell injections (G21+ spleen) showed a trend toward greater improvement (p=0.053) in LIDs compared to rats receiving allografts alone (G21) following secondary immune challenge. (B) Total graft-induced dyskinesias (GIDs; tapping dyskinesias + facial forelimb dyskinesias) for all groups over 21 weeks. The emergence of novel (e.g.: not seen prior to grafting) dyskinetic behaviors was noted in all allografted rats and was significantly increased over sham treated rats by week 4 post-grafting (*p<0.05). (C) Tapping dyskinesias phenotype showed a significant increase in all allografted rats by 4 weeks post-grafting compared to sham-treated rats (*p<0.05). There was a further augmentation in this behavioral phenotype in the G21 + spleen group, compared with G21 group on weeks 10 (+p=0.03) and 18 (++p=0.01) post-grafting. (D) Facial forelimb dyskinesias phenotype showed a significant increase in all allografted rats at 4 weeks post-grafting compared to sham-treated rats (*p<0.05). Syngeneic-grafted rats observed in a previous study in our laboratory, undergoing the identical experimental protocol as used for allografted rats in this study, failed to develop post-graft motor abnormalities (D).
Figure 3
Figure 3. Tyrosine hydroxylase (TH, blue) and MHC class II molecule (MHC II, brown) immunostained, coronal brain sections in the dopamine-depleted striatum
A) Sham treated rats showed an absence of TH innervation and sparse MHC class II expression. B) Allografted rats sacrificed at 10 weeks post-grafting (G10) showed numerous TH+ cells as well as moderate MHC class II expression at the site of the graft. C) Allografted rats sacrificed on week 21 post-grafting (G21) showed abundant TH+ cells and a reduced expression MHC class II expression compared to G10. D) Allografted rats receiving peripheral spleen cell injections and sacrificed at 21 weeks (G21 + spleen) showed some remaining TH+ cells and robust MHC class II expression. Scale bar in A represents 1mm and is valid for A–D.
Figure 4
Figure 4. Tyrosine hydroxylase and MHC class II cell counts
(A) While there was approximately 50% fewer TH+ cells in the DA-depleted striatum of spleen challenged allografted rats, there was no statistical difference between the allograft groups (p= 0.45). (B) The number of MHC class II+ cells in the DA-depleted striatum differed significantly between groups (p=0.03) with G21 + spleen rats showing significantly more compared to G21 rats (*p< 0.05). (C) While there was a trend for higher numbers of MHC class II+ cells to be associated with lower numbers of surviving TH+ cells this correlation was not statistically significant (r=−0.37, p=0.06).
Figure 5
Figure 5. Electron micrographs of the dopamine-depleted striatum illustrating the presence of grafted dopaminergic neurons (A), fibers (B), and the host inflammatory response (C–D)
(A) Low power ultrastructure micrograph of a dopaminergic neuron showing close proximity to a small interneuron (*), which can be identified by the deep indentations in the nuclear envelop. Scale bar= 2μm. (B) Low power micrograph of a TH+ fiber coursing through the extracellular space. (C) Low power micrograph of microglia (*) found in the striatum of a G21 + spleen rat. (D) High power micrograph of a large secondary lysosome filled with debris, dense protein, and parallel membranes. Scale bar in C= 2μm and D= 250nm.
Figure 6
Figure 6. Electron micrographs of synaptic profiles in the intact and grafted striatum
A, B) In the intact hemisphere synapses formed typical arrangements with TH+ terminals forming symmetric contacts (A: upper arrow, B: arrow) onto spines (A: upper arrow, B: arrow) and non-TH+ asymmetric synapses (A: lower arrow) forming contacts onto the head of the spine. Note the dense core vesicles in the TH+ terminal (A: asterisk). Scale bar for A and B=100nm. C, D) In the grafted hemisphere TH+ synapses showed more atypical arrangements sometimes forming asymmetric contacts (high power micrographs D and E: arrow and asterisk) and often contacting dendrites as opposed to spines (low power micrograph C: arrow; high power micrograph D: arrow). Figures F and G show schematic diagrams of this change in distribution of TH+ synaptic target (F) and synaptic specialization (G) between the intact and grafted striata. (F) The distribution of synaptic targets in the grafted striata differed significantly from the intact hemisphere (p< 0.001), as well as from one another, (p< 0.001; G10 vs. G21: p<0.001, G10 vs. G21 + spleen: p< 0.001, G21 vs. G21 + spleen: p<0.001). (G) The distribution of synaptic symmetry also differed significantly between allografted groups (p<0.001; G10 vs. G21: p= 0.003, G10 vs. G21 + spleen: p< 0.001, G21 vs. G21 + spleen: p= 0.003) with the percent of TH+ asymmetric specializations increasing with both time post-grafting and host immune response.
Figure 7
Figure 7. High power electron micrographs illustrating unlabeled synapses (asterisks) onto TH+ dendrites (A, C) and soma (B) in the grafted striatum
Scale bars in A and C= 150nm; scale bar in B= 300nm. The quantitative distribution of the synaptic specializations of these terminals onto TH+ cell bodies and proximal dendrites in the grafted striatum differed significantly between the allografted groups (p< 0.001) with a significantly greater percentage of asymmetric synapses seen in G21 and G21 + spleen rats compared to G10 rats (G10 vs. G21: p< 0.001, G10 vs. G21 + spleen: p< 0.001).
Figure 8
Figure 8. Quantitative distribution of non-TH+ postsynaptic targets (A) and perforation status (B)
(A) In the dopamine-grafted striata, the distribution of postsynaptic targets of non-TH+ synapses differed significantly from their intact hemispheres (p< 0.001). Further, dopamine-grafted groups differed from one another (p= 0.001), with grafted groups having increased immune activation (G10 and G21 + spleen) showing a significantly greater percentage of inputs onto dendrites rather than spines (G10 vs. G21: p= 0.035, G21 + spleen vs. G21: p< 0.001). These groups, however, did not differ from one another (G10 vs. G21 + spleen: p= 0.201). (B) In the dopamine-grafted striata, the distribution of perforated synapses did not differ significantly from the intact hemisphere in either G10 or G21 rats (p= 0.25). However, in grafted rats with increased immune activation there was a significant difference between both the grafted and intact hemisphere (p< 0.05) as well as with G10 (p<0.05) and G21 (p< 0.05) rats.
Figure 9
Figure 9. Correlation between the percentage of contacts made by grafted cells onto dendritic spines in the dopamine-depleted striatum and dyskinetic behavioral profiles
The percentage of TH+ contacts onto spines was significantly, negatively correlated with tapping dyskinesias (C; r=−0.65, p=0.005), however, there was no significant correlation of this synapse profile with LIDs (A; p=0.91), total GIDs (B; p=0.31), or facial forelimb dyskinesias alone (D; p=0.78).
Figure 10
Figure 10. Correlation between the percentage of non-TH+ asymmetric contacts onto grafted cells in the dopamine-depleted striatum and dyskinetic behavioral profiles
The percentage of asymmetric contacts onto TH+ cells was significantly, positively correlated with total GIDs behavior (B; p=0.02), but not with LIDs (A; p=0.87), tapping dyskinesias alone (C; p=0.09), or facial forelimb dyskinesias alone (D; p=0.24).
Figure 11
Figure 11. Correlation between the percentage of non-TH+ perforated asymmetric contacts in the dopamine-depleted striatum and dyskinetic behavioral profiles
The percent of perforated asymmetric contacts onto TH+ cells was significantly, positively correlated with total GIDs behavior (B; p=0.03), but not with LIDs (A; p=0.15), tapping dyskinesias alone (C; p=0.23), or facial forelimb dyskinesias alone (D; p=0.06).
Figure 12
Figure 12. Correlation between the levodopa-induced dyskinesias (A, C) and graft-induced aberrant behaviors (B, D) and TH+ cell counts (A, B) and aberrant synaptology (C, D)
While classic LID-like behaviors correlated positively to the number of surviving TH+ cells in the grafted striatum, they did not correlate with the aberrant synaptic features noted in this study. This is in contrast to GID-like behaviors observed which correlated significantly with aberrant synaptology but not with TH+ cell counts.
Figure 13
Figure 13. Illustration summarizing the aberrant synaptic features observed in the grafted striatum of rats with elevated immune status and high level dyskinesia
A dopamine graft, in an environment of elevated immune factors, may be a target of aberrant focal activation, creating an excess excitatory drive in the grafted stratium. It is well established that focal stimulation of striatum results in focal output of stereotyped behavior, which is dependent upon which area of striatum is stimulated (Mink et al., 2003; Kelley et al., 1994). The distributions of TH+ axo-dendritic and axo-somatic synapses (*), TH+ asymmetric specializations (**), non-TH+ perforated syanpses (†), and asymmetrical synapses onto TH+ cells (††) were all significantly increased in allografted rats with increased immune activation. These increases in aberrant synaptic features in the allografted striatum, may represent a mechanism by which focal striatal excitation is driving aberrant behaviors following grafting in this study.

Similar articles

Cited by

References

    1. Anglade P, Mouatt-Prigent A, Agid Y, Hirsch E. Synaptic plasticity in the caudate nucleus of patients with Parkinson’s disease. Neurodegeneration. 1996;5:121–8. - PubMed
    1. Arbuthnott G, Dunnett S, MacLeod N. Electrophysiological properties of single units in dopamine-rich mesencephalic transplants in rat brain. Neurosci Lett. 1985;57:205–10. - PubMed
    1. Bains JS, Oliet SH. Glia: they make your memories stick! Trends Neurosci. 2007;30:417–24. - PubMed
    1. Beattie EC, Stellwagen D, Morishita W, Bresnahan JC, Ha BK, Von Zastrow M, Beattie MS, Malenka RC. Control of synaptic strength by glial TNF alpha. Science. 2002;295:2282–5. - PubMed
    1. Bolam JP. Synapses of identified neurons in the neostriatum. Ciba Found Symp. 1984;107:30–47. - PubMed

Publication types

MeSH terms