. 2008 Nov;1784(11):1641-51.
doi: 10.1016/j.bbapap.2008.07.001. Epub 2008 Jul 11.

Detailed kinetics and regulation of mammalian NAD-linked isocitrate dehydrogenase

Affiliations

Detailed kinetics and regulation of mammalian NAD-linked isocitrate dehydrogenase

Feng Qi et al. Biochim Biophys Acta. 2008 Nov.

Abstract

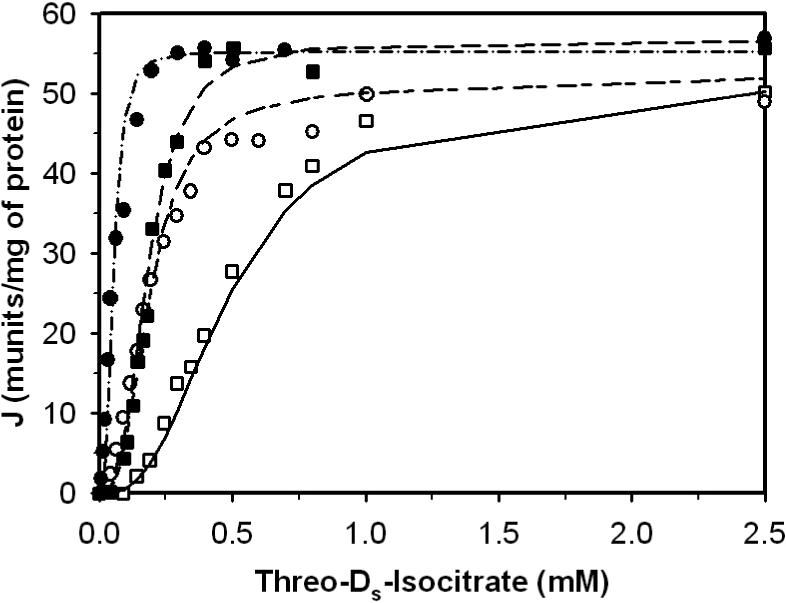
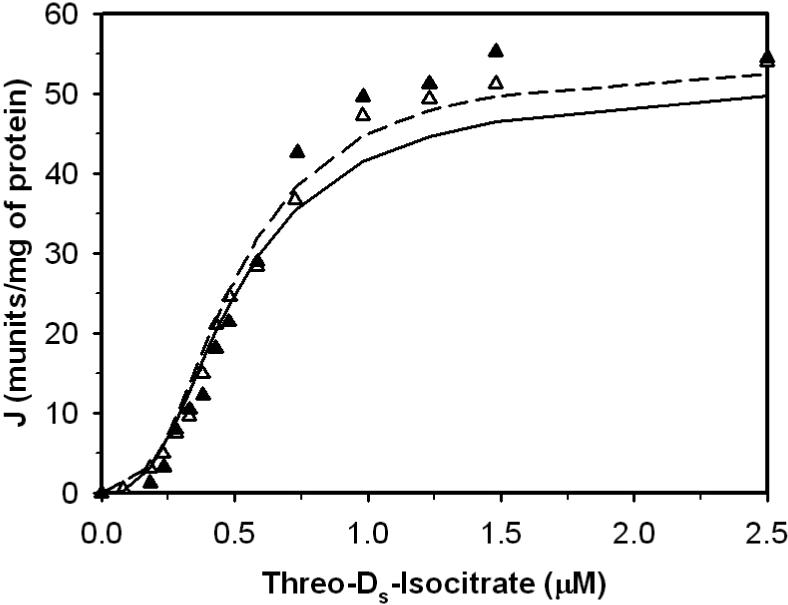
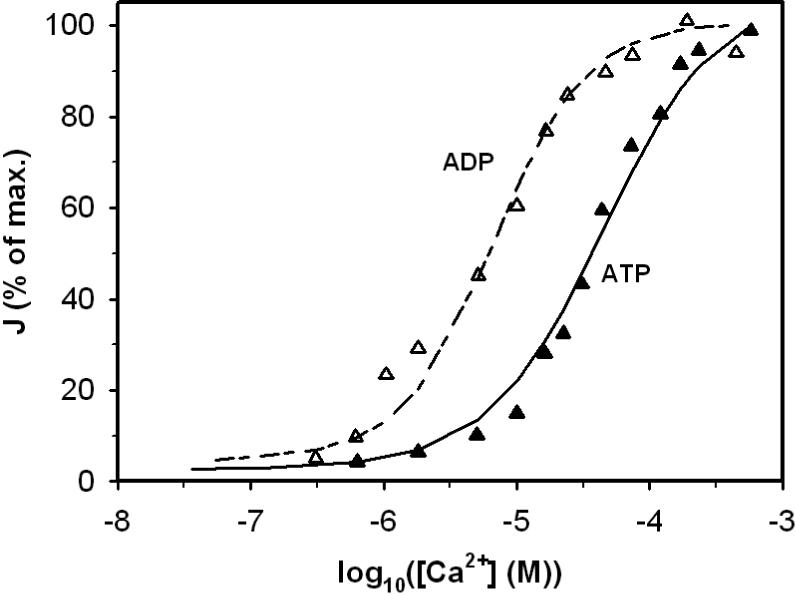
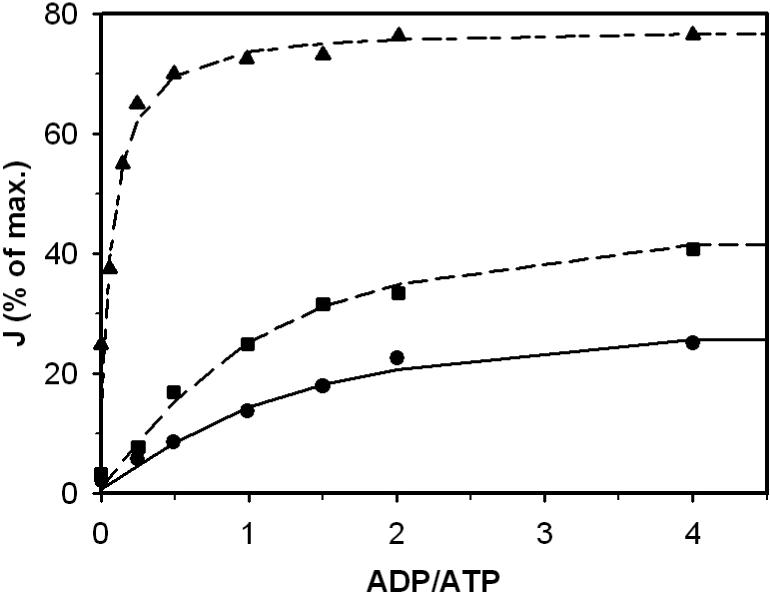
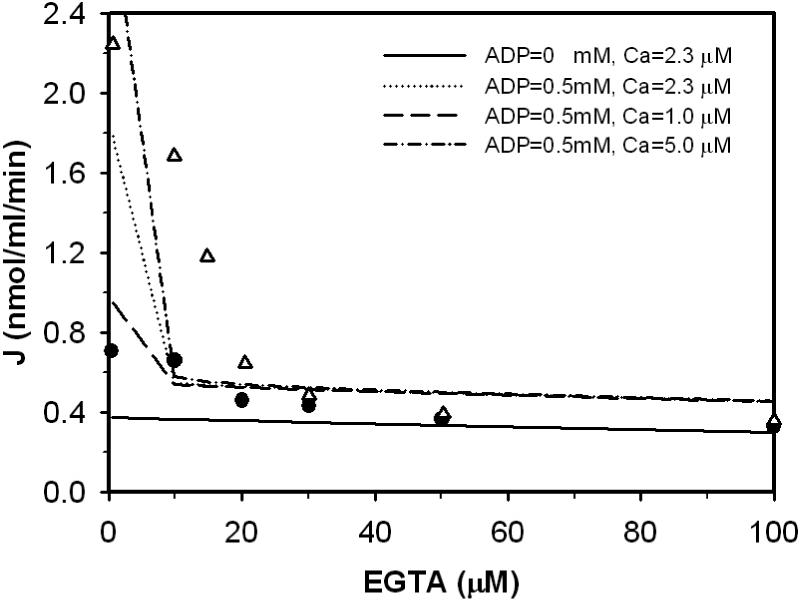
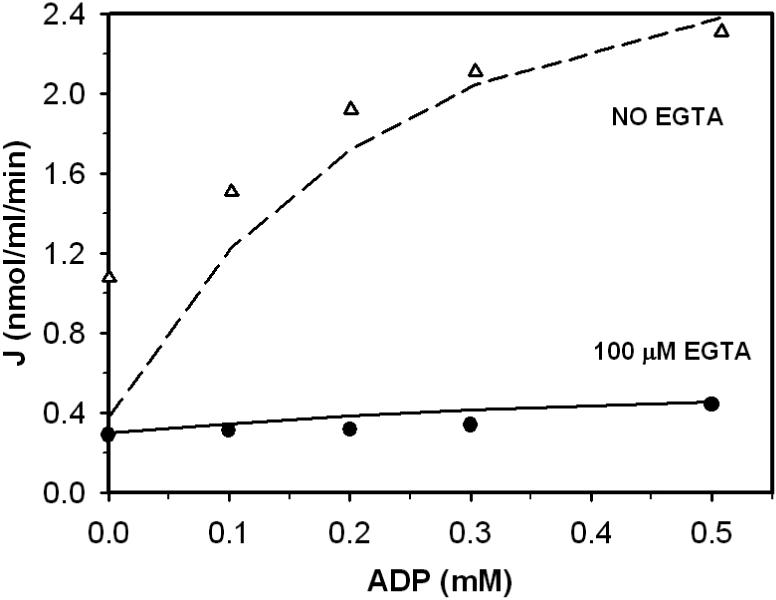
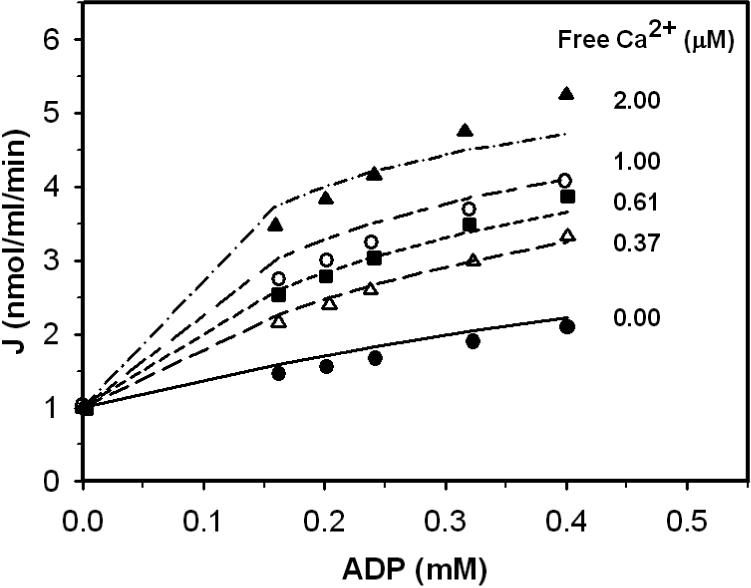
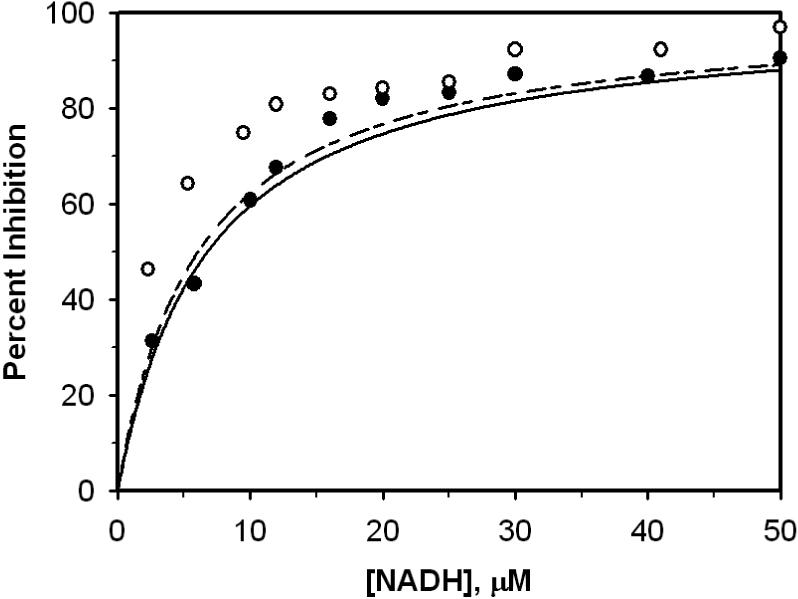
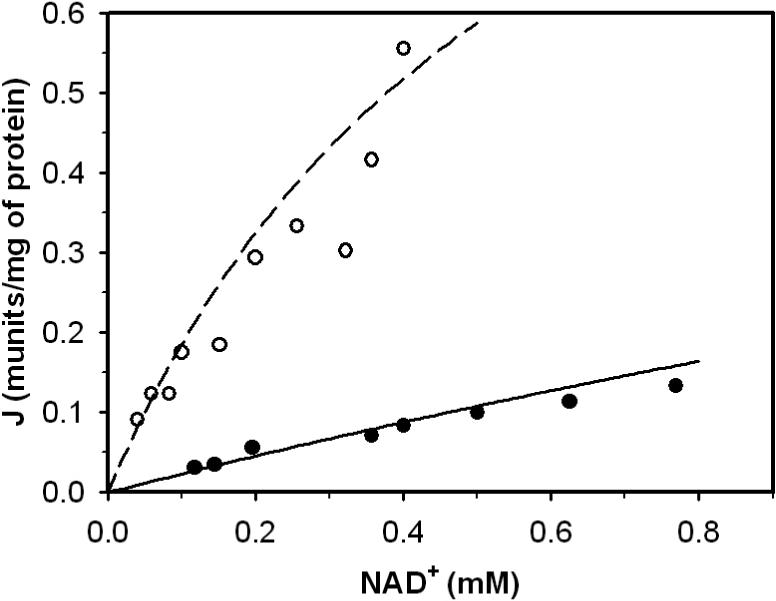
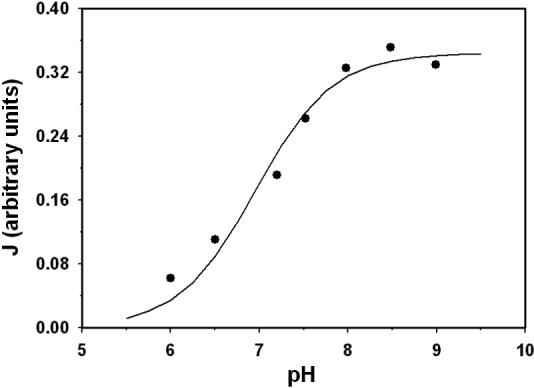
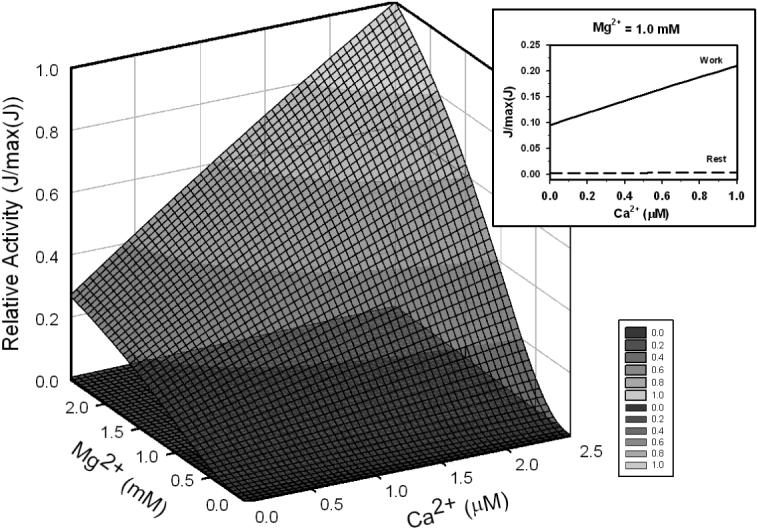
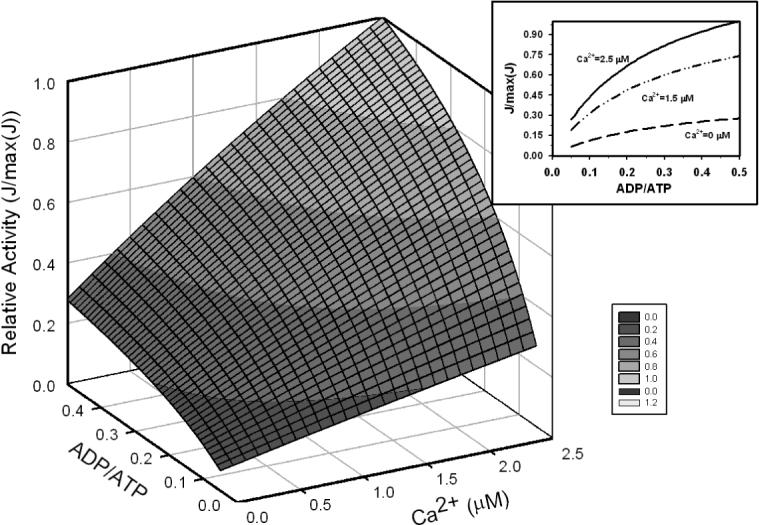
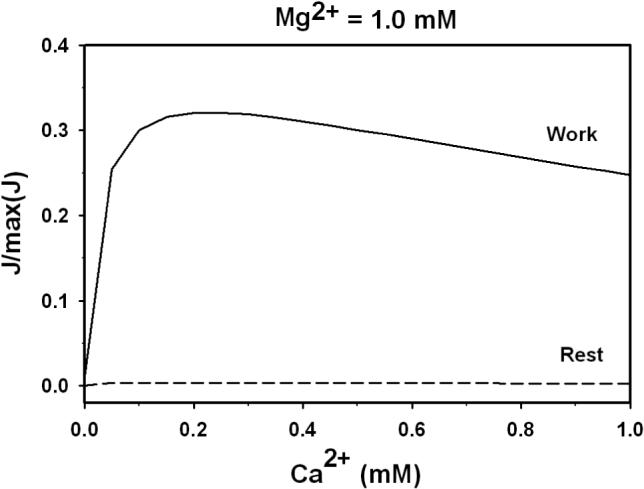
A mathematical model is presented to describe the catalytic mechanism of mammalian NAD-linked isocitrate dehydrogenase (NAD-IDH), a highly regulated enzyme in the tricarboxylic acid cycle, a crucial pathway in energy metabolism and biosynthesis. The mechanism accounts for allosteric regulation by magnesium-bound isocitrate and EGTA and calcium-bound ATP and ADP. The developed model is used to analyze kinetic data for the cardiac enzyme and to estimate kinetic parameter values. Since the kinetic mechanism is expressed in terms of chemical species (rather than biochemical reactants), the model explicitly accounts for the effects of biochemical state (ionic strength, pH, temperature, and metal cation concentration) on the kinetics. Because the substrate isocitrate competes with allosteric activators (ATP and ADP) and an inhibitor (EGTA) for metal ion cofactors (Ca(2+) and Mg(2+)), the observed kinetic relationships between reactants, activator and inhibitor concentrations, and catalytic flux are complex. Our analysis reveals that under physiological conditions, the ADP/ATP ratio plays a more significant role than Ca(2+) concentration in regulating the enzyme's activity. In addition, the enzyme is highly sensitive to Mg(2+) concentration in the physiological range, pointing to a potential regulatory role of [Mg(2+)] in mitochondrial energy metabolism.


Figures

Figure 1
Figure 1
Fits to kinetic data from Figure 2a (left) of [23] on the forward operation of toluene-permeabilized enzyme. Open symbols (□, ○) represent data obtained without significant Ca2+ in the assay. Closed symbols (■, •) represent the presence of 0.1 mM free [Ca2+]. Circles and squares correspond to data obtained in the presence of 1.5 mM ADP and ATP, respectively; All data were obtained from Figure 2a of [23]. Solid line, long-short line, long dash line and dash-dot line are fits to the data points represented by symbols □, ○, ■ , and •, respectively.
Figure 2
Figure 2
Fits to kinetic data from Figure 2a (right panel) of [23] on the forward operation of toluene-permeabilized enzyme. Symbols ▲ and Δ represents the pre sence and the absence of calcium in the buffer, respectively. Solid and dashed lines are fits to the data with and without calcium, respectively. No ATP or ADP was present for these experiments. Free [Ca2+] was 0.1 mM for the ▲ data set.
Figure 3
Figure 3
The effect of ATP and ADP on the activation effect of calcium to the enzyme activity. Symbols ▲ and Δ represent data obtained from Figure 3 of [23], obtained in the presence of either 1.5 mM [ATP] or [ADP]. Solid line and long-short line are fits to the data.
Figure 4
Figure 4
The effect of ADP/ATP ratio on the enzyme activity at different calcium concentrations. Solid line, long-dash line and long-short line are fits to the kinetic data obtained from Figure 4 of [23]. The sum of ATP and ADP concentration was held fixed 1.5 mM. Symbols •, ■ and ○ represent free calcium concentrations of 1 nM, 1 μM and 0.1 mM, respectively.
Figure 5
Figure 5
Fits to kinetic data on the forward operation of purified NAD-IDH from bovine heart. Measured flux as a function of concentrations of ADP and EGTA was obtained from Figures 2 of [14]. Data symbols are as follows: Δ data obtained at 0.5 mM ADP; • data obtained in the absence of ADP. Dot-dot line and solid line represent model fits to the data with free [Ca2+] set to 2.3 μM. Dash-dash line and dash-dot line represent model predictions at 1.0 and 5.0 μM [Ca2+].
Figure 6
Figure 6
Impact of [EGTA2−] and [ADP] on bovine heart enzyme. Measured flux in units of nmol/ml/min was obtained from Figure 3 of [14]. The buffer contained 1.0 mM MgSO4, 0.2 mM DL-isocitrate and 3.0μM endogenous Ca2+. Symbols • and Δ represents fluxes measured as a function of ADP in the presence and the absence of EGTA in the buffer, respectively. Solid and dashed lines represent model fits to data with and without EGTA.
Figure 7
Figure 7
Activation effect of ADP to bovine heart enzyme in the presence of calcium. Measured flux in units of nmol/ml/min was obtained from Figures 7 of [14]. Flux is plotted as a function of activator ADP concentration for free [Ca2+] = 0 μM (•), 0.37 μM (Δ), 0.61 μM (■), 1.00 μM (○) and 2.00 μM (▲). Solid line, long-short line, long dash line and dash-dot line are model fits to •, Δ, ■, ○ , and ▲, respectively.
Figure 8
Figure 8
Inhibition effect of NADH on the enzyme activity in the absence and presence ([ADP3−]=0.2 mM] of ADP. Percent inhibition was computed from 100(v0-v)/v0, whre v0 and v were the initial velocities in the absence and presence of inhibitor; Open circle and closed circle represent data obtained in the presence and absence of ADP. Dash line and solid line are model predictions to ○ and •.
Figure 9
Figure 9
Enzyme activity as a function of NAD+ in the absence of presence of NADH. Closed circle and open circle represent data obtained in the presence ([NADH] = 0.039 mM) and absence of NADH. Dash line and solid line are model predictions to ○ and •.
Figure 10
Figure 10
The maximum enzyme activity as a function of pH. Data points represent the measured maximum flux (relative) obtained by extrapolation of double-reciprocal plots [40]. Model fit is plotted as solid line.
Figure 11
Figure 11
Regulation effect of Mg2+ and Ca2+on the enzyme behavior in rest (ATPase = 0 and work conditions (ATPase = 0.25 mmol sec−1 (liter cytoplasm)−1). Reactant concentrations are computed for steady states using the cell energetics model of Wu et al. [24]; concentrations are listed in Table 4. Insert: activation effect of Ca2+ on the enzyme at free [Mg2+] = 1.0 mM; solid line represents work condition and long-dash line represents rest condition.
Figure 12
Figure 12
Enzyme activity as a function of ADP/ATP ratio and Ca2+. Insert: activation effect of ADP/ATP ratio on the enzyme at Ca2+=0 μM (long-dash), 1.5 μM (long-dot-dot) and 2.5 μM (solid). Total [ATP] + [ADP] is fixed at 10 mM; other reactant concentrations are set to values corresponding to the work state in Table 4. All calculations were done at free [Mg2+] = 1.0 mM.
Figure 13
Figure 13
Inhibition effect of high Ca2+ concentration. This figure plots the enzyme activity under the conditions in the insert of Figure 11 at higher Ca2+ concentration. The solid line represents work condition (ATPase = 0.25 mmol sec−1 (liter cytoplasm)−1) and dashed line represents rest condition (ATPase = 0). All calculations were done at free [Mg2+] = 1.0 mM.

References

    1. Hansford RG. Relation between mitochondrial calcium transport and control of energy metabolism. Rev Physiol Biochem Pharmacol. 1985;102:1–72. - PubMed
    1. Williamson JR, Cooper RH. Regulation of the citric acid cycle in mammalian systems. FEBS Lett. 1980;117(Suppl):K73–85. - PubMed
    1. Gabriel JL, Zervos PR, Plaut GW. Activity of purified NAD-specific isocitrate dehydrogenase at modulator and substrate concentrations approximating conditions in mitochondria. Metabolism. 1986;35(7):661–667. - PubMed
    1. Plaut GW, Sung SC. Diphosphopyridine nucleotide isocitric dehydrogenase from animal tissues. J Biol Chem. 1954;207(1):305–314. - PubMed
    1. Goebell H, Klingenberg M. [Dpn-Specific Isocitrate Dehydrogenase of Mitochondria. I. Kinetic Properties, Occurrence and Function of Dpn-Specific Isocitrate Dehydrogenase.]. Biochem Z. 1964;340:441–464. - PubMed

Publication types

LinkOut - more resources