

Minimally elevated cardiac troponin T and elevated N-terminal pro-B-type natriuretic peptide predict mortality in older adults: results from the Rancho Bernardo Study
- PMID: 18672166
- PMCID: PMC2613773
- DOI: 10.1016/j.jacc.2008.04.033
Minimally elevated cardiac troponin T and elevated N-terminal pro-B-type natriuretic peptide predict mortality in older adults: results from the Rancho Bernardo Study
Abstract
Objectives: This study investigated the prognostic value of detectable cardiac troponin T (TnT) and elevated N-terminal pro-B-type natriuretic peptide (NT-proBNP) levels in a population of community-dwelling older adults.
Background: Minimally elevated levels of TnT, a marker of cardiomyocyte injury, have been found in small subsets of the general population, with uncertain implications. A marker of ventricular stretch, NT-proBNP has clinical utility in many venues, but its long-term prognostic value in apparently healthy older adults and in conjunction with TnT is unknown.
Methods: Participants were 957 older adults from the Rancho Bernardo Study with plasma NT-proBNP and TnT measured at baseline (1997 to 1999) and followed up for mortality through July 2006.
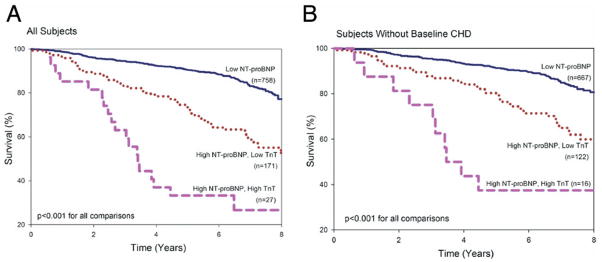
Results: Participants with detectable TnT (>/=0.01 ng/ml, n = 39) had an increased risk of all-cause and cardiovascular death (adjusted hazard ratio [HR] by Cox proportional hazards analysis: 2.06; 95% confidence interval [CI]: 1.29 to 3.28, p = 0.003 for all-cause mortality; HR: 2.06, 95% CI: 1.03 to 4.12, p = 0.040 for cardiovascular mortality); elevated NT-proBNP also predicted an increased risk of all-cause and cardiovascular mortality (adjusted HR per unit-log increase in NT-proBNP: 1.85, 95% CI: 1.36 to 2.52, p < 0.001 for all-cause mortality; HR: 2.51, 95% CI: 1.55 to 4.08, p < 0.001 for cardiovascular mortality). Those with both elevated NT-proBNP and detectable TnT had poorer survival (HR for high NT-proBNP and detectable TnT vs. low NT-proBNP and any TnT: 3.20, 95% CI: 1.91 to 5.38, p < 0.001). Exclusion of the 152 participants with heart disease at baseline did not materially change the TnT mortality or NT-proBNP mortality associations.
Conclusions: Apparently healthy adults with detectable TnT or elevated NT-proBNP levels are at increased risk of death. Those with both TnT and NT-proBNP elevations are at even higher risk, and the increased risk persists for years.
Figures


Comment in
-
Elevated N-terminal pro-B-type natriuretic peptide levels: the effect of chronic obstructive pulmonary disease.J Am Coll Cardiol. 2009 Feb 3;53(5):458; author reply 458-9. doi: 10.1016/j.jacc.2008.09.047. J Am Coll Cardiol. 2009. PMID: 19179209 Free PMC article. No abstract available.
References
-
- Newby LK, Roe MT, Chen AY, et al. Frequency and clinical implications of discordant creatine kinase-MB and troponin measurements in acute coronary syndromes. J Am Coll Cardiol. 2006;47:312–8. - PubMed
-
- Antman EM, Tanasijevic MJ, Thompson B, et al. Cardiac-specific troponin I levels to predict the risk of mortality in patients with acute coronary syndromes. N Engl J Med. 1996;335:1342–9. - PubMed
-
- Ohman EM, Armstrong PW, Christenson RH, et al. Cardiac troponin T levels for risk stratification in acute myocardial ischemia. GUSTO IIA Investigators. N Engl J Med. 1996;335:1333–41. - PubMed
-
- Steen H, Giannitsis E, Futterer S, Merten C, Juenger C, Katus HA. Cardiac troponin T at 96 hours after acute myocardial infarction correlates with infarct size and cardiac function. J Am Coll Cardiol. 2006;48:2192–4. - PubMed
-
- Westerhout CM, Fu Y, Lauer MS, et al. Short- and long-term risk stratification in acute coronary syndromes: the added value of quantitative ST-segment depression and multiple biomarkers. J Am Coll Cardiol. 2006;48:939–47. - PubMed
Publication types
MeSH terms
Substances
Grants and funding
LinkOut - more resources
Full Text Sources
Research Materials
