

The epidemiology of progression of pure geographic atrophy: the Beaver Dam Eye Study
- PMID: 18672224
- PMCID: PMC2612630
- DOI: 10.1016/j.ajo.2008.05.050
The epidemiology of progression of pure geographic atrophy: the Beaver Dam Eye Study
Abstract
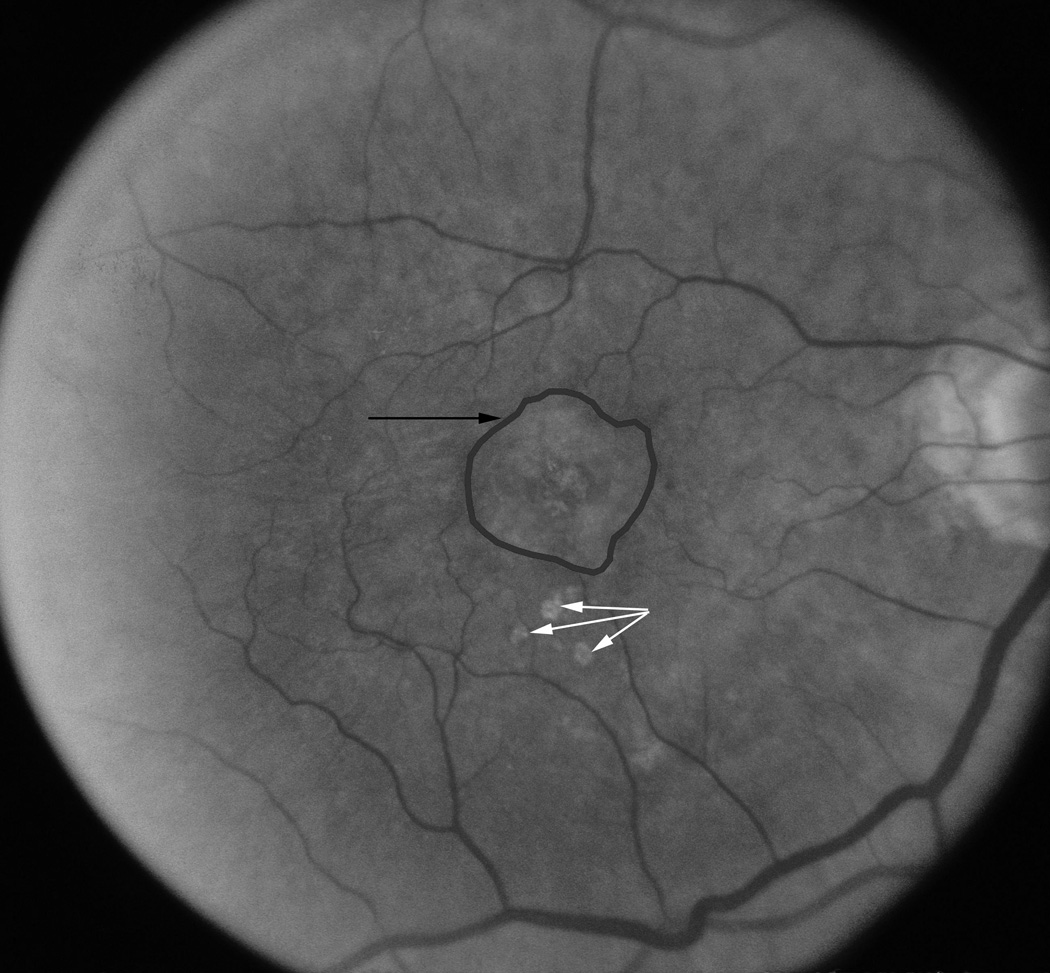
Purpose: To examine the change in size and location of pure geographic atrophy (GA).
Design: Population-based cohort study.
Methods: Ninety-five persons with GA either at baseline or at the one of the three five-year follow-up examinations, or both, were identified. Using computer-assisted software, the lesion area and greatest linear dimension (GLD) were calculated. Thirty-two persons (53 multiple eye-visit pairs) were seen at multiple visits five years apart with GA in the same eye to evaluate changes in total area and GLD.
Results: At the first occasion when pure GA was identified (n = 95), 45% had a single GA lesion, 18% had multifocal GA lesions, and 37% had a merged GA lesion. Of 53 eyes with multiple visits, the overall increase in atrophy was 6.4 mm(2) over a five-year period. The atrophy progressed to involve the foveal center in 47% of 19 eyes, and there was a mean decrease of 17 letters read correctly. Eyes with multifocal GA were most likely to have the area of atrophy increase (mean, 12 mm(2)), to have atrophy progress to the foveal center (83%), and to have a decrease in vision (mean, 22 letters), whereas eyes with a single GA lesion were least likely to have the area of atrophy increase (mean, 2 mm(2)), to have the lesion progress to the foveal center (22%), and to have a decrease in vision (mean, 10 letters).
Conclusions: These are the first population-based data describing the five-year change in eyes with pure GA. Information on progression of GA will be useful for clinical trials of new interventions for GA.
Figures


References
-
- Congdon N, O'Colmain B, Klaver CC, et al. Causes and prevalence of visual impairment among adults in the United States. Arch Ophthalmol. 2004;122:477–485. - PubMed
-
- Klein R, Klein BE, Lee KE, Cruickshanks KJ, Gangnon RE. Changes in visual acuity in a population over a 15-year period: the Beaver Dam Eye Study. Am J Ophthalmol. 2006;142:539–549. - PubMed
-
- Chang TS, Bressler NM, Fine JT, Dolan CM, Ward J, Klesert TR. Improved vision-related function after ranibizumab treatment of neovascular age-related macular degeneration: results of a randomized clinical trial. Arch Ophthalmol. 2007;125:1460–1469. - PubMed
-
- Kaiser PK, Brown DM, Zhang K, et al. Ranibizumab for predominantly classic neovascular age-related macular degeneration: subgroup analysis of first-year ANCHOR results. Am J Ophthalmol. 2007;144:850–857. - PubMed
-
- Klein R, Klein BE, Knudtson MD, Meuer SM, Swift M, Gangnon RE. Fifteen-year cumulative incidence of age-related macular degeneration: the Beaver Dam Eye Study. Ophthalmology. 2007;114:253–262. - PubMed
Publication types
MeSH terms
Grants and funding
LinkOut - more resources
Full Text Sources
Medical
