. 2008 Nov;115(11):1923-9.
doi: 10.1016/j.ophtha.2008.05.025. Epub 2008 Jul 31.

High-resolution Fourier-domain optical coherence tomography and microperimetric findings after macula-off retinal detachment repair

Affiliations

High-resolution Fourier-domain optical coherence tomography and microperimetric findings after macula-off retinal detachment repair

Allison J Smith et al. Ophthalmology. 2008 Nov.

Abstract

Objective: To evaluate the morphologic changes in the macula of subjects with repaired macula-off retinal detachment (RD) using high-resolution Fourier-domain optical coherence tomography (FD OCT) and to perform functional correlation in a subset of patients using microperimetry (MP-1).

Design: Prospective observational case series.

Participants: Seventeen eyes from 17 subjects who had undergone anatomically successful repair for macula-off, rhegmatogenous RD at least 3 months earlier and without visually significant maculopathy on funduscopy.

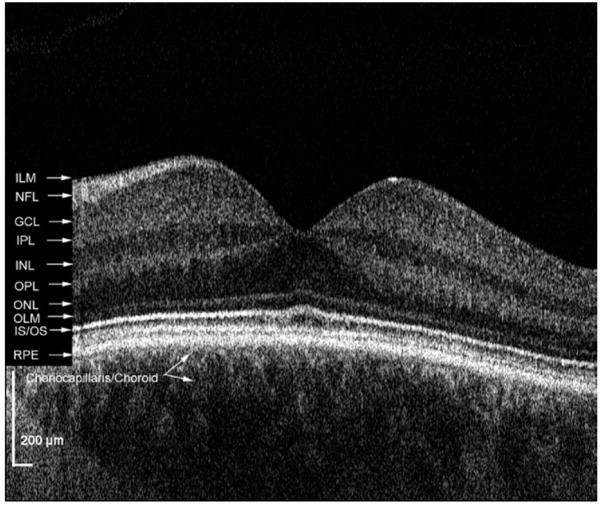
Methods: FD OCT with axial and transverse resolution of 4.5 mum and 10 to 15 mum, respectively, was used to obtain rapid serial B-scans of the macula, which were compared with that from Stratus OCT. The FD OCT B-scans were used to create a 3-dimensional volume, from which en face C-scans were created. Among 11 patients, MP-1 was performed to correlate morphologic changes with visual function.

Main outcome measures: Stratus OCT scans, FD OCT scans, and MP-1 data.

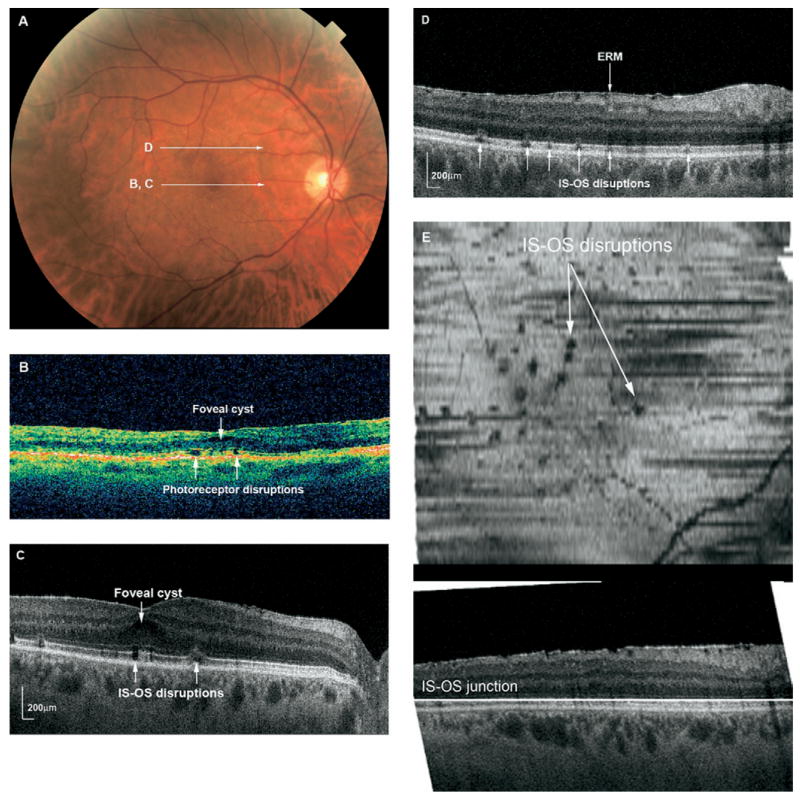
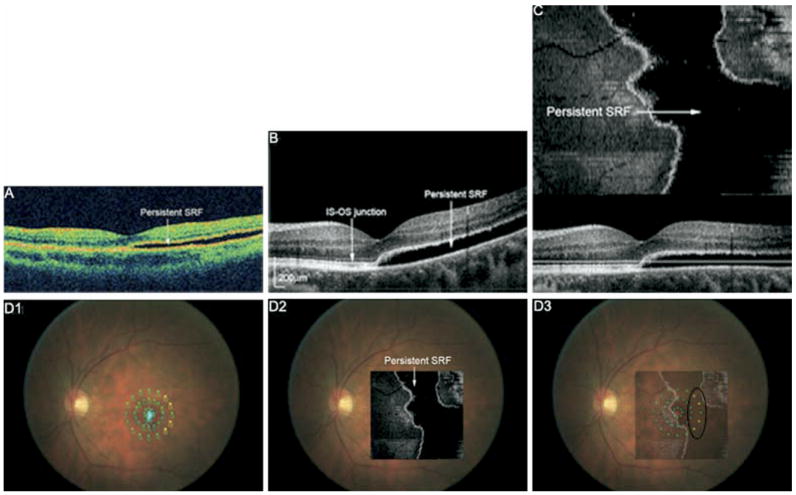
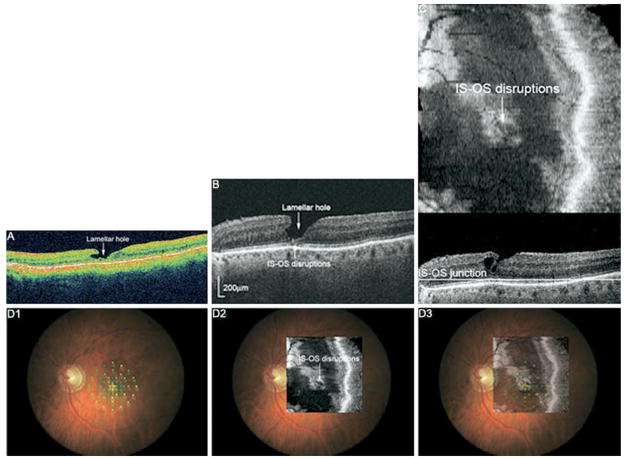
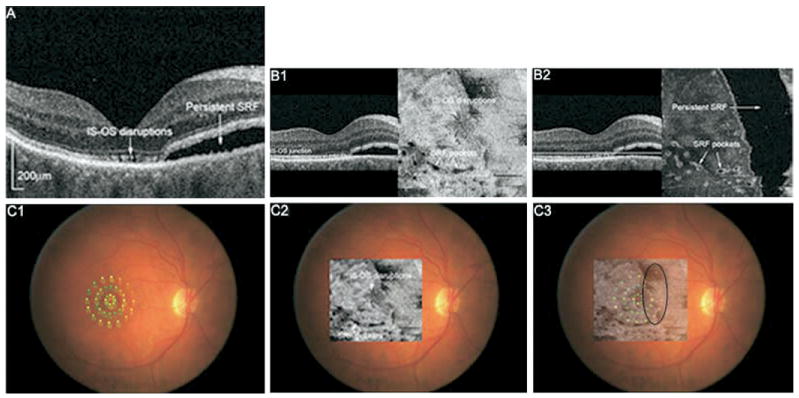
Results: Stratus OCT and FD OCT images of the macula were obtained 3 to 30 months (mean 7 months) postoperatively in all eyes. Although Stratus OCT revealed photoreceptor disruption in 2 eyes (12%), FD OCT showed photoreceptor disruption in 13 eyes (76%). This difference was statistically significant (P<0.001, chi(2)). Both imaging modalities revealed persistent subretinal fluid in 2 eyes (12%) and lamellar hole in 1 eye. Among 7 subjects who had reliable MP-1 data, areas of abnormal function corresponded to areas of photoreceptor layer disruptions or persistent subretinal fluid in 5 subjects (71%); one subject had normal FD OCT and MP-1.

Conclusions: Photoreceptor disruption after macula-off RD repair is a common abnormality in the macula that is detected better with FD OCT than Stratus OCT. A good correlation between MP-1 abnormality and presence of photoreceptor disruption or subretinal fluid on FD OCT demonstrates that these anatomic abnormalities contribute to decreased visual function after successful repair.


Figures

Figure 1
Figure 1
High-resolution FD OCT of a normal subject with retinal layers labeled. GCL = ganglion cell layer; ILM = internal limiting membrane; INL = inner nuclear layer; IPL = inner plexiform layer; IS/OS = inner segment/outer segment junction; NFL = nerve fiber layer; OLM = outer limiting membrane; ONL = outer nuclear layer; OPL = outer plexiform layer; RPE = retinal pigment epithelium.
Figure 2
Figure 2
A, Fundus photograph of the right eye of Patient 8 shows a mild epiretinal membrane 7 months after RD repair. Visual acuity was 20/50. White arrows indicate direction of OCT scanning in corresponding figures (B–D). B, Stratus OCT showing small defects in the photoreceptor layer and a small foveal cyst. C, FD OCT B-scan through the fovea showing focal subfoveal and juxtafoveal disruptions in the photoreceptor IS-OS junction. D, Selected FD OCT B-scan through superior macula illustrating the focal photoreceptor layer disruptions scattered throughout the macula, as well as an epiretinal membrane. E, C-scan (en face) through the IS-OS junction showing the focal hypointensities throughout the macula. The horizontal line in the lower B-scan depicts the level at which the transverse C-scan is taken. ERM = epiretinal membrane; IS-OS = inner segment-outer segment.
Figure 3
Figure 3
A, Stratus OCT of Patient 2 showing shallow SRF involving the fovea 12 months after pneumatic retinopexy. Visual acuity was 20/20, and the patient had no subjective visual symptoms. B, FD OCT B-scan also shows persistent SRF and an unremarkable photoreceptor layer (IS-OS junction) in the detached and attached macula. C, Flattened FD OCT C-scan indicating the extent of SRF in the macula. D1, MP with threshold values shown. Small, light blue dots indicate the patient’s fixation. D2, Flattened C-scan overlain onto fundus photograph. D3, Flattened C-scan superimposed onto MP indicates decreased sensitivity (yellow dots) in the temporal area of persistent SRF (black circle). SRF = subretinal fluid; IS-OS = inner segment-outer segment.
Figure 4
Figure 4
A, Stratus OCT of Patient 4 showing a lamellar hole at the fovea and extending nasally 30 months after vitrectomy/scleral buckle surgery. Visual acuity was 20/25, and mild metamorphopsia is noted. B, FD OCT B-scan shows the lamellar hole and subfoveal disruption of the photoreceptor layer (IS-OS junction). C, FD OCT C-scan through the photoreceptor layer shows the extent of disruption in the macula. D1, MP with threshold values. D2, C-scan overlain onto fundus photograph. D3, C-scan superimposed onto MP indicates decreased sensitivity in the area of photoreceptor layer disruption (black circle). IS-OS = inner segment-outer segment.
Figure 5
Figure 5
A, FD OCT B-scan image of Patient 3 showing photoreceptor layer disruption at the fovea and persistent SRF nasally 3 months after scleral buckle surgery. Visual acuity was 20/60. B1, Flattened C-scan through the IS-OS junction showing fine disruptions near the fovea and small pockets of SRF inferiorly. B2, Flattened C-scan slightly above the photoreceptor layer illustrates the extent of SRF in the macula. C1, MP-1 with threshold values shown. C2, Photoreceptor layer C-scan overlain onto fundus photograph. C3, Photoreceptor layer C-scan superimposed onto MP-1 indicates diffuse decrease in sensitivity diffusely and most pronounced nasally in the area of persistent SRF. IS-OS = inner segment-outer segment.

Comment in

  • OCT Interpretation.
    Byeon SH, Kang SY. Byeon SH, et al. Ophthalmology. 2009 Jul;116(7):1419, 1419.e1-2; author reply 1419-20. doi: 10.1016/j.ophtha.2009.03.009. Ophthalmology. 2009. PMID: 19576510 No abstract available.

References

    1. Abouzeid H, Wolfensberger TJ. Macular recovery after retinal detachment. Acta Ophthalmol Scand. 2006;84:597– 605. - PubMed
    1. Huang D, Swanson EA, Lin CP, et al. Optical coherence tomography. Science. 1991;254:1178 – 81. - PMC - PubMed
    1. Lecleire-Collet A, Muraine M, Menard JF, Brasseur G. Predictive visual outcome after macula-off retinal detachment surgery using optical coherence tomography. Retina. 2005;25:44 –53. - PubMed
    1. Wolfensberger TJ, Gonvers M. Optical coherence tomography in the evaluation of incomplete visual acuity recovery after macula-off retinal detachments. Graefes Arch Clin Exp Ophthalmol. 2002;240:85–9. - PubMed
    1. Benson SE, Schlottmann PG, Bunce C, et al. Optical coherence analysis of the macula after vitrectomy surgery for retinal detachment. Ophthalmology. 2006;113:1179 – 83. - PubMed

Publication types

MeSH terms