

MRI measures of temporoparietal regions show differential rates of atrophy during prodromal AD
- PMID: 18672473
- PMCID: PMC2577003
- DOI: 10.1212/01.wnl.0000320055.57329.34
MRI measures of temporoparietal regions show differential rates of atrophy during prodromal AD
Abstract
Background: MRI studies have demonstrated differential rates of atrophy in the entorhinal cortex and hippocampus during the prodromal phase of Alzheimer disease (AD). The current study was designed to determine whether a broader set of temporoparietal regions show differential rates of atrophy during the evolution of AD.
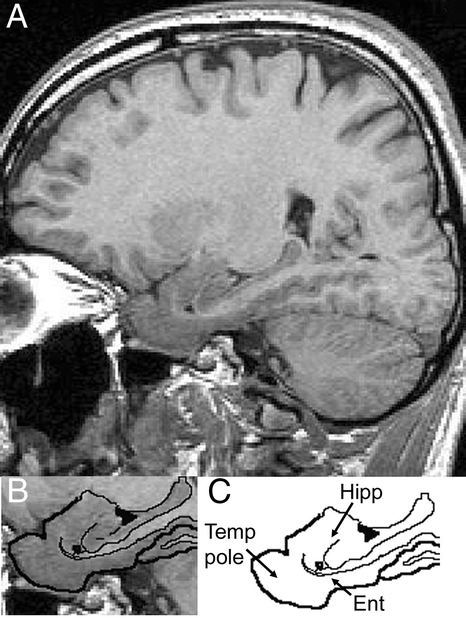
Methods: Sixteen regions of interest (ROIs) were analyzed on MRI scans obtained at baseline and follow-up in 66 subjects comprising three groups: controls = individuals who were cognitively normal at both baseline and follow-up; nonconverters = subjects with mild cognitive impairment (MCI) at both baseline and follow-up; converters had MCI at baseline but had progressed to AD at follow-up.
Results: Annualized percent change was analyzed with multivariate analysis of variance (MANOVA), covaried for age. The MANOVA demonstrated an effect of group (p = 0.004). Post hoc comparisons demonstrated greater rates of atrophy for converters vs nonconverters for six ROIs: hippocampus, entorhinal cortex, temporal pole, middle temporal gyrus, fusiform gyrus, and inferior temporal gyrus. Converters showed differentially greater rates of atrophy than controls in five of the same ROIs (and inferior parietal lobule). Rates of change in clinical status were correlated with the atrophy rates in these regions. Comparisons between controls and nonconverters demonstrated no differences.
Conclusion: These results demonstrate that temporoparietal regions show differential rates of atrophy on MRI during prodromal Alzheimer disease (AD). MRI data correlate with measures of clinical severity and cognitive decline, suggesting the potential of these regions of interest as antemortem markers of prodromal AD.
Figures
References
-
- Braak H, Braak E. Neuropathological stageing of Alzheimer-related changes. Acta Neuropathol (Berl) 1991;82:239–259. - PubMed
-
- Braak H, Braak E. Evolution of neuronal changes in the course of Alzheimer’s disease. J Neural Transm Suppl 1998;53:127–140. - PubMed
-
- Tiraboschi P, Hansen LA, Thal LJ, Corey-Bloom J. The importance of neuritic plaques and tangles to the development and evolution of AD. Neurol 2004;62:1984–1989. - PubMed
-
- McKee AC, Au R, Cabral HJ, et al. Visual association pathology in preclinical Alzheimer disease. J Neuropathol Exp Neurol 2006;65:621–630. - PubMed
-
- Thal DR, Capetillo-Zarate E, Del Tredici K, Braak H. The development of amyloid beta protein deposits in the aged brain. Sci Aging Knowledge Environ 2006 Mar 8. - PubMed
Publication types
MeSH terms
Grants and funding
LinkOut - more resources
Full Text Sources
Other Literature Sources
Medical