

Epigenetic mechanisms involved in differential MDR1 mRNA expression between gastric and colon cancer cell lines and rationales for clinical chemotherapy
- PMID: 18673531
- PMCID: PMC2529328
- DOI: 10.1186/1471-230X-8-33
Epigenetic mechanisms involved in differential MDR1 mRNA expression between gastric and colon cancer cell lines and rationales for clinical chemotherapy
Abstract
Background: The membrane transporters such as P-glycoprotein (Pgp), the MDR1 gene product, are one of causes of treatment failure in cancer patients. In this study, the epigenetic mechanisms involved in differential MDR1 mRNA expression were compared between 10 gastric and 9 colon cancer cell lines.
Methods: The MDR1 mRNA levels were determined using PCR and real-time PCR assays after reverse transcription. Cytotoxicity was performed using the MTT assay. Methylation status was explored by quantification PCR-based methylation and bisulfite DNA sequencing analyses.
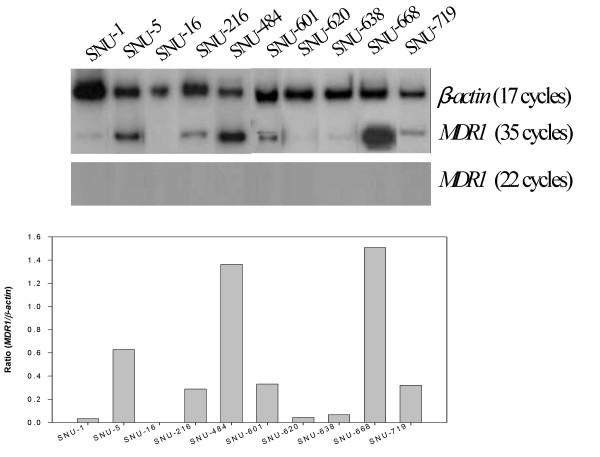
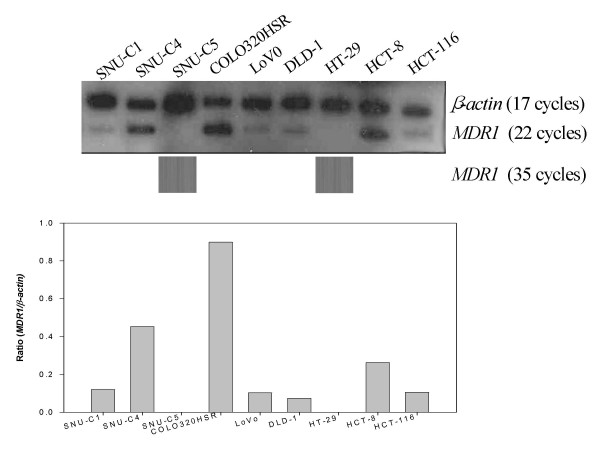
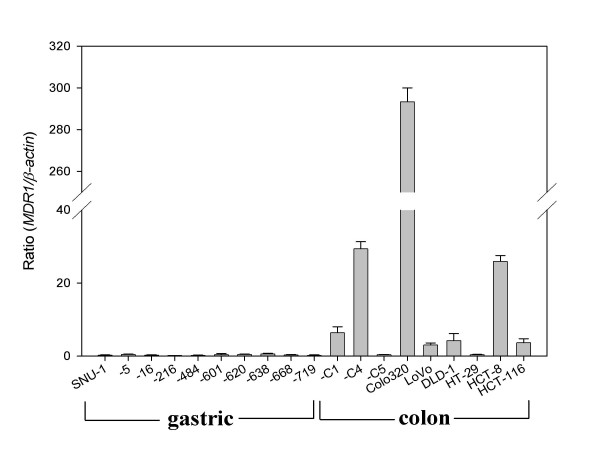
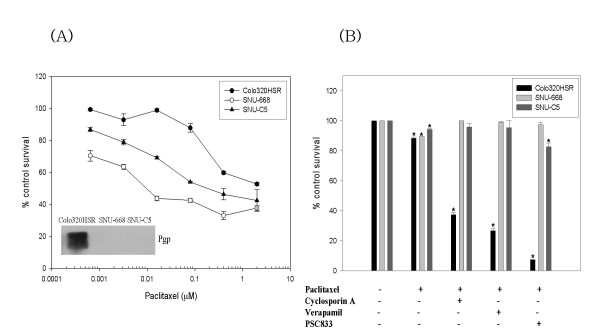
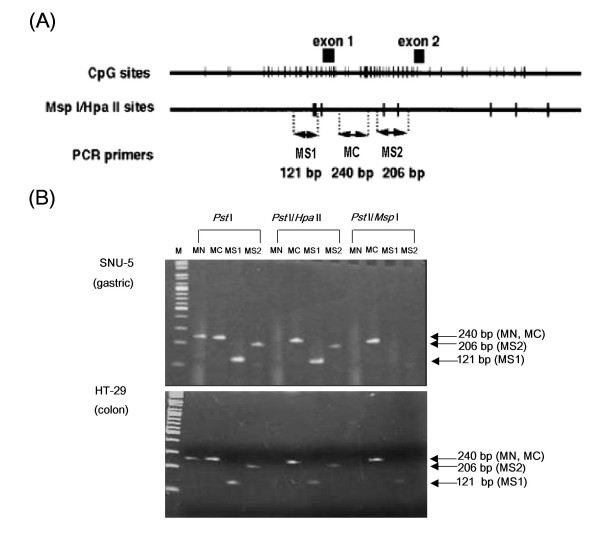
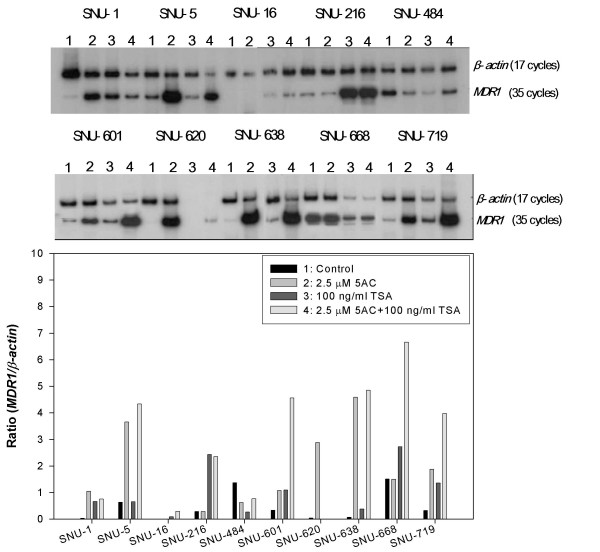
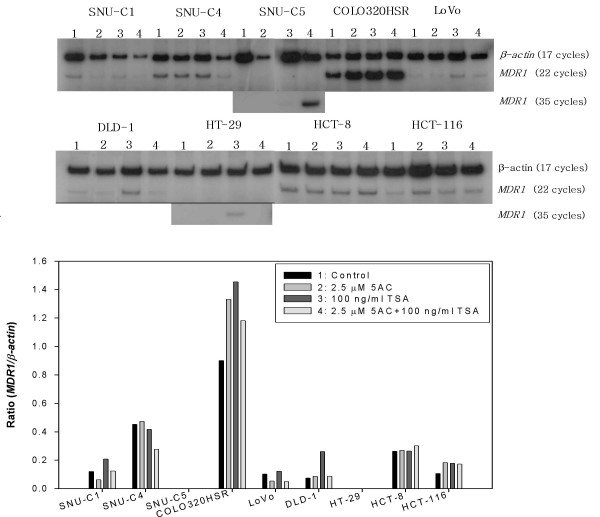
Results: The MDR1 mRNA levels obtained by 35 cycles of RT-PCR in gastric cancer cells were just comparable to those obtained by 22 cycles of RT-PCR in colon cancer cells. Real-time RT-PCR analysis revealed that MDR1 mRNA was not detected in the 10 gastric cancer cell lines but variable MDR1 mRNA levels in 7 of 9 colon cancer cell lines except the SNU-C5 and HT-29 cells. MTT assay showed that Pgp inhibitors such as cyclosporine A, verapamil and PSC833 sensitized Colo320HSR (colon, highest MDR1 expression) but not SNU-668 (gastric, highest) and SNU-C5 (gastric, no expression) to paclitaxel. Quantification PCR-based methylation analysis revealed that 90% of gastric cancer cells, and 33% of colon cancer cells were methylated, which were completely matched with the results obtained by bisulfite DNA sequencing analysis. 5-aza-2'-deoxcytidine (5AC, a DNA methyltransferase inhibitor) increased the MDR1 mRNA levels in 60% of gastric cells, and in 11% of colon cancer cells. Trichostatin A (TSA, histone deacetylase inhibitor) increased the MDR1 mRNA levels in 70% of gastric cancer cells and 55% of colon cancer cells. The combined treatment of 5AC with TSA increased the MDR1 mRNA levels additively in 20% of gastric cancer cells, but synergistically in 40% of gastric and 11% of colon cancer cells.
Conclusion: These results indicate that the MDR1 mRNA levels in gastric cancer cells are significantly lower than those in colon cancer cells, which is at least in part due to different epigenetic regulations such as DNA methylation and/or histone deacetylation. These results can provide a better understanding of the efficacy of combined chemotherapy as well as their oral bioavailability.
Figures
Similar articles
-
MDR1 promoter hypermethylation in MCF-7 human breast cancer cells: changes in chromatin structure induced by treatment with 5-Aza-cytidine.Cancer Biol Ther. 2004 Jun;3(6):540-8. doi: 10.4161/cbt.3.6.845. Epub 2004 Jun 10. Cancer Biol Ther. 2004. PMID: 15034303
-
Different involvement of DNA methylation and histone deacetylation in the expression of solute-carrier transporters in 4 colon cancer cell lines.Biol Pharm Bull. 2012;35(3):301-7. doi: 10.1248/bpb.35.301. Biol Pharm Bull. 2012. PMID: 22382314
-
Dual regulation of P-glycoprotein expression by trichostatin A in cancer cell lines.BMC Mol Biol. 2012 Jul 30;13:25. doi: 10.1186/1471-2199-13-25. BMC Mol Biol. 2012. PMID: 22846052 Free PMC article.
-
Epigenetic regulation of MDR1 gene through post-translational histone modifications in prostate cancer.BMC Genomics. 2013 Dec 17;14:898. doi: 10.1186/1471-2164-14-898. BMC Genomics. 2013. PMID: 24344919 Free PMC article.
-
Prevention of carcinogenesis and development of gastric and colon cancers by 2-aminophenoxazine-3-one (Phx-3): direct and indirect anti-cancer activity of Phx-3.Int J Mol Sci. 2013 Aug 28;14(9):17573-83. doi: 10.3390/ijms140917573. Int J Mol Sci. 2013. PMID: 23989604 Free PMC article. Review.
Cited by
-
ANXA9 as a novel prognostic biomarker associated with immune infiltrates in gastric cancer.PeerJ. 2021 Dec 15;9:e12605. doi: 10.7717/peerj.12605. eCollection 2021. PeerJ. 2021. PMID: 35003923 Free PMC article.
-
DNA and histone methylation in gastric carcinogenesis.World J Gastroenterol. 2013 Feb 28;19(8):1182-92. doi: 10.3748/wjg.v19.i8.1182. World J Gastroenterol. 2013. PMID: 23482412 Free PMC article. Review.
-
A phase I and pharmacodynamic study of the histone deacetylase inhibitor belinostat plus azacitidine in advanced myeloid neoplasia.Invest New Drugs. 2015 Apr;33(2):371-9. doi: 10.1007/s10637-014-0194-2. Epub 2014 Dec 9. Invest New Drugs. 2015. PMID: 25483416 Free PMC article. Clinical Trial.
-
Elevated level of lysine 9-acetylated histone H3 at the MDR1 promoter in multidrug-resistant cells.Cancer Sci. 2012 Apr;103(4):659-69. doi: 10.1111/j.1349-7006.2012.02215.x. Epub 2012 Mar 19. Cancer Sci. 2012. PMID: 22320423 Free PMC article.
-
ABCB1 regulation through LRPPRC is influenced by the methylation status of the GC -100 box in its promoter.Epigenetics. 2014 Aug;9(8):1172-83. doi: 10.4161/epi.29675. Epub 2014 Jul 2. Epigenetics. 2014. PMID: 25089713 Free PMC article.
References
-
- Pozzo C, Barone C, Szanto J, Padi E, Peschel C, Bukki J, Gorbunova V, Valvere V, Zaluski J, Biakhov M, et al. Irinotecan in combination with 5-fluorouracil and folinic acid or with cisplatin in patients with advanced gastric or esophageal-gastric junction adenocarcinoma: results of a randomized phase II study. Ann Oncol. 2004;15:1773–1781. - PubMed
-
- Kelland L. The resurgence of platinum-based cancer chemotherapy. Nature reviews. 2007;7:573–584. - PubMed
-
- Noordhuis P, Holwerda U, Wilt CL Van der, Van Groeningen CJ, Smid K, Meijer S, Pinedo HM, Peters GJ. 5-Fluorouracil incorporation into RNA and DNA in relation to thymidylate synthase inhibition of human colorectal cancers. Ann Oncol. 2004;15:1025–1032. - PubMed
-
- Riordan JR, Ling V. Purification of P-glycoprotein from plasma membrane vesicles of Chinese hamster ovary cell mutants with reduced colchicine permeability. J Biol Chem. 1979;254:12701–12705. - PubMed
-
- Vernhet L, Courtois A, Allain N, Payen L, Anger JP, Guillouzo A, Fardel O. Overexpression of the multidrug resistance-associated protein (MRP1) in human heavy metal-selected tumor cells. FEBS Lett. 1999;443:321–325. - PubMed
Publication types
MeSH terms
Substances
LinkOut - more resources
Full Text Sources
Medical
Research Materials
Miscellaneous
