. 2008 Aug 1:9:43.
doi: 10.1186/1471-2121-9-43.

Single cell cytometry of protein function in RNAi treated cells and in native populations

Affiliations

Single cell cytometry of protein function in RNAi treated cells and in native populations

Peter LaPan et al. BMC Cell Biol. .

Abstract

Background: High Content Screening has been shown to improve results of RNAi and other perturbations, however significant intra-sample heterogeneity is common and can complicate some analyses. Single cell cytometry can extract important information from subpopulations within these samples. Such approaches are important for immune cells analyzed by flow cytometry, but have not been broadly available for adherent cells that are critical to the study of solid-tumor cancers and other disease models.

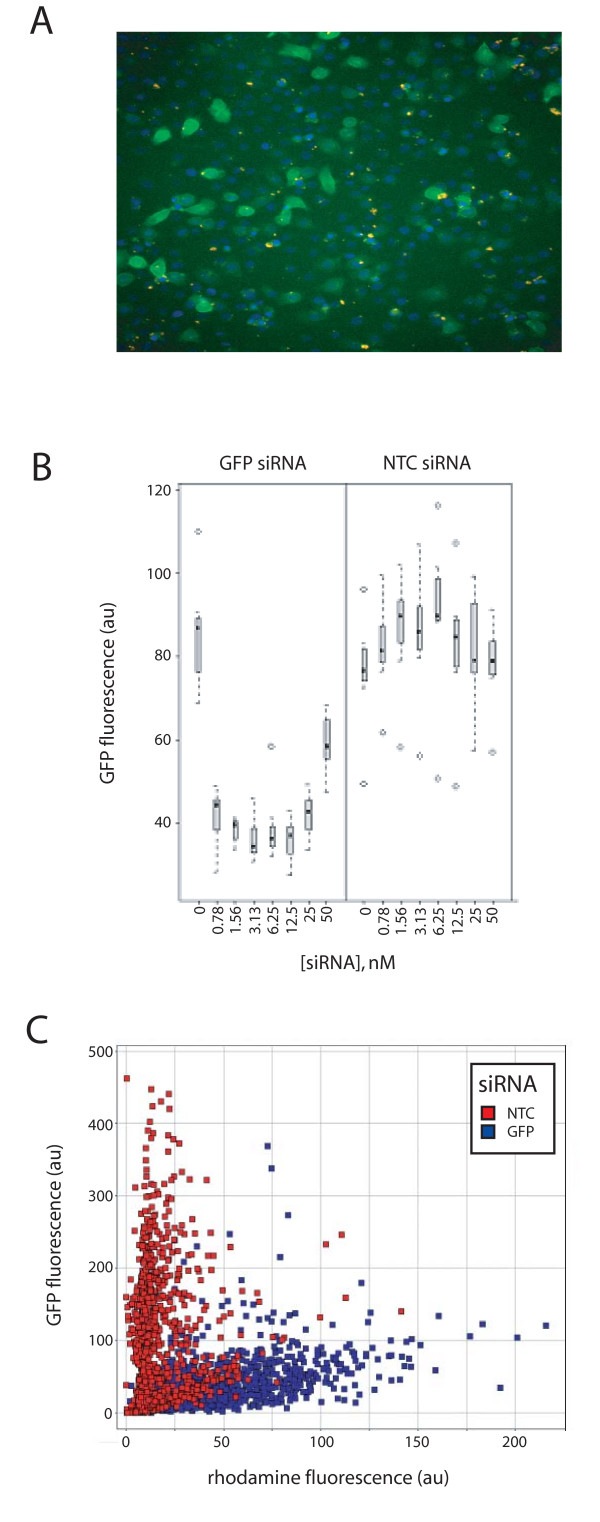
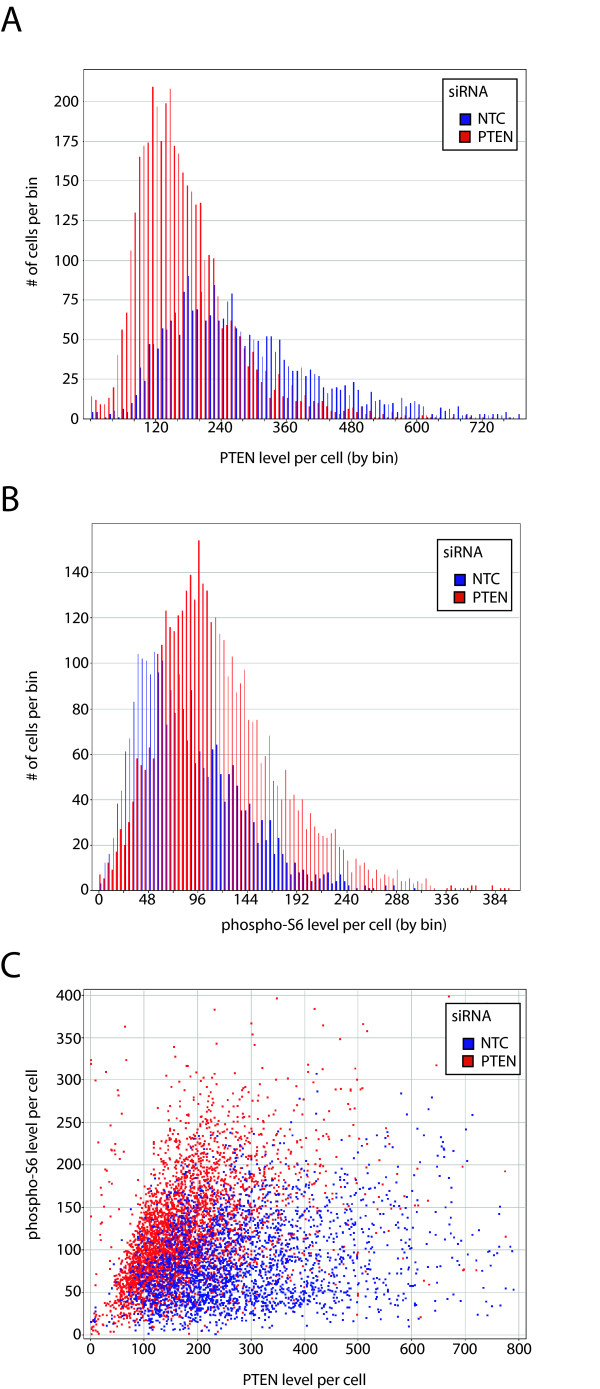
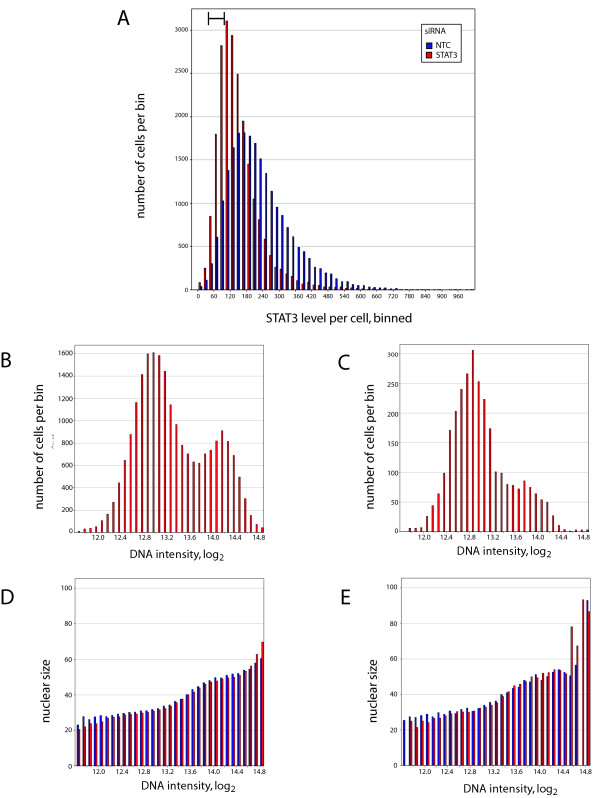
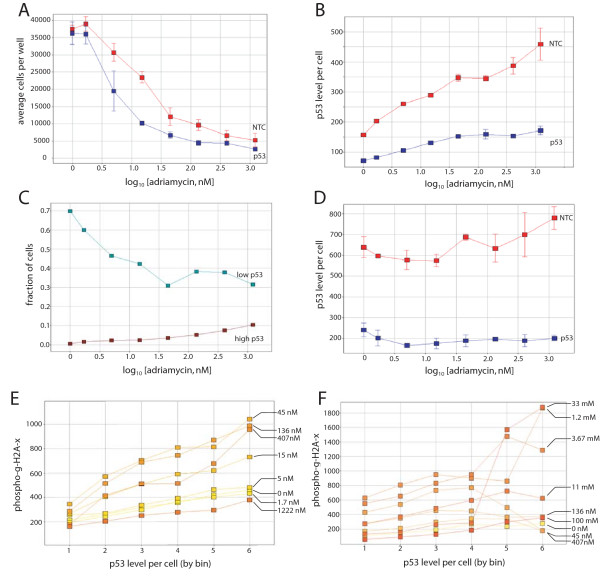
Results: We have directly quantitated the effect of resolving RNAi treatments at the single cell level in experimental systems for both exogenous and endogenous targets. Analyzing the effect of an siRNA that targets GFP at the single cell level permits a stronger measure of the absolute function of the siRNA by gating to eliminate background levels of GFP intensities. Extending these methods to endogenous proteins, we have shown that well-level results of the knockdown of PTEN results in an increase in phospho-S6 levels, but at the single cell level, the correlation reveals the role of other inputs into the pathway. In a third example, reduction of STAT3 levels by siRNA causes an accumulation of cells in the G1 phase of the cell cycle, but does not induce apoptosis or necrosis when compared to control cells that express the same levels of STAT3. In a final example, the effect of reduced p53 levels on increased adriamycin sensitivity for colon carcinoma cells was demonstrated at the whole-well level using siRNA knockdown and in control and untreated cells at the single cell level.

Conclusion: We find that single cell analysis methods are generally applicable to a wide range of experiments in adherent cells using technology that is becoming increasingly available to most laboratories. It is well-suited to emerging models of signaling dysfunction, such as oncogene addition and oncogenic shock. Single cell cytometry can demonstrate effects on cell function for protein levels that differ by as little as 20%. Biological differences that result from changes in protein level or pathway activation state can be modulated directly by RNAi treatment or extracted from the natural variability intrinsic to cells grown under normal culture conditions.


Figures

Figure 1
Figure 1
Single cell analysis of siRNA knockdown of GFP. siRNAs transfected at increasing doses into RWPE-1 cells stably transduced to constitutively express GFP, are correlated with the reduction of GFP expression, as determined by fluorescence intensity. A. GFP-siRNA accumulation and correlation with GFP levels observed by fluorescence microscopy. B. Average GFP fluorescence levels of wells treated with a GFP-specific siRNA or a non-targeting control siRNA, as indicated. Each box plot displays the median and intrerquartile range of 8 wells. C. For the transfection of siRNAs at a concentration of 3.13 nM, the cells of one well are plotted individually for both GFP and rhodamine fluorescence intensities.
Figure 2
Figure 2
Wide distributions are observed in endogenous protein levels for cultured cell lines. Antigen intensity was determined by high content screening following fixation and staining with antibodies that were specific for the indicated protein. Quantitation was achieved by a whole cell mask, which was dilated out from the nuclear region identified by DAPI staining. A. Endogenous expression levels of proteins are shown for two breast cell lines, the immortalized line 184B5 and the estrogen-sensitive breast cancer cell line T47D, shown as well or sample mean values of all of the cells. Proteins examined in this study, as indicated in the figure, were quantitated by indirect immunofluorescence and image analysis, and values for each cell are plotted as individual points. All graphs are to the same scale, indicated in the lower left. Approximately 7000 cells were quantitated per sample (antigen/cell line). B. Display of sample distributions for the proteins indicated in (A). Data is presented as histograms of cells with increasing levels (total fluorescence intensity, or the sum of all pixel intensities, per cell) of the indicated proteins. C. Contribution of cells stratified by antigen intensities on overall abundance measurements. Data is as in panel B, but calculated as the product of the number of cells per bin times the average antigen intensity for that bin. As such, the contribution of each bin to the total well mean response is represented. D-F. Correlations between two proteins in cell populations. Protein levels per cell are shown for T47D cells, as indicated in the graphs. Protein levels are mean average fluorescence intensities per cell, as indicated in the axes labels.
Figure 3
Figure 3
siRNA-mediated knockdown of PTEN and its effect on phosphorylation of ribosomal protein S6. The breast carcinoma cell line MDA-MB-231 was treated with siRNAs to characterize the correlation between PTEN levels and ribosomal protein S6 phosphorylation levels. ~15,000 cells are presented. A. PTEN levels displayed as a histogram for samples treated with an siRNA targeting PTEN or a non-targeting control, as indicated. B. Ribosomal protein S6 phosphorylation for the same cells as in A, shown as a histogram of phosphorylation levels as reported by immunofluorescence intensities. C. Pairwise correlation for PTEN and phospho-S6 levels at the single cell level for data presented in A and B.
Figure 4
Figure 4
siRNA mediated knockdown of STAT3. A. Histogram of STAT3 levels in SW480 colon carcinoma cells treated with STAT3 and NTC (non-targeting) siRNAs. Red bars denote STAT3 siRNA treated cells and blue bars represent NTC treated cells. Data presents ~22,000 cells for samples treated with STAT3 and NTC siRNAs each. A region of low-STAT3 expressing cells examined in panels (C) and (E) is indicated in the panel (top left corner). B. DNA histogram of cells treated with the STAT3 siRNA. C. DNA histogram of low-STAT3 expressing cells (cells are highlighted in panel A). D. Nuclear size as a function of DNA content for the entire dataset. E. Nuclear size as a function of DNA content for the low-STAT3 cells highlighted in part A, for both STAT3 and NTC treated cells. The measure of DNA content for panels B-E are identical, and therefore the comparison of nuclear size as a function of DNA content may be made directly to the fraction of cells in each phase of the cell cycle (panels C and D, respectively). Color schemes for panels D and E are as in A.
Figure 5
Figure 5
Dependence of p53 on the response to adriamycin is observed in both p53 siRNA treated cells and in untreated cells with low levels of p53. A. DLD-1 colon carcinoma cells treated with increasing doses of adriamycin as indicated in the figure. Cells were treated with an siRNA targeting GFP (blue) or an NTC (red). Cells not treated with adriamycin were treated with DMSO. B. p53 levels following siRNA treatment. An siRNA that targets p53 (blue) or a non-targeting control (red), are shown. siRNA treatments as described in A. C. The fraction of cells within each concentration of adriamycin for the NTC treated sample is shown. The fractions of cells with the highest and lowest 20% of the range of p53 levels (burgundy and teal, respectively) in the untreated sample are shown at each concentration of adriamycin. The range of p53 levels in each bin is 0–200 FU for the lowest bin and 800–1000 FU for the highest bin. D. p53 levels following p53 or NTC siRNA treatment for 48 hours, and adriamycin treatment for 6 hours. siRNA treatments as described in A E. Levels of γ-phosphorylated histone H2A-x levels as a function of p53 levels per cell and adriamycin treatment for 6 hours. Adriamycin doses are as shown in other panels, in a color range from yellow (no adriamycin) to orange (1.222 μM adriamycin). Each data point represents 200–400 cells. F. Same as (E), except cells were not treated with an NTC siRNA. Adriamycin concentrations are indicated in the panel.

Similar articles

Cited by

References

    1. Hannon GJ. RNAi: A Guide to Gene Silencing. 1. Cold Spring Harbor, NY, USA , Cold Spring Harbor Press; 2003. p. 436.
    1. Appasani K. In: RNA Interference Technology: From Basic Science to Drug Development. 1st. Appasani K, editor. Cambridge, UK , Cambridge University Press; 2005. p. 510.
    1. Aza-Blanc P, Cooper CL, Wagner K, Batalov S, Deveraux QL, Cooke MP. Identification of modulators of TRAIL-induced apoptosis via RNAi-based phenotypic screening. Molecular Cell. 2003;12:627–637. - PubMed
    1. Berns K, Hijmans EM, Mullenders J, Brummelkamp TR, Velds A, Heimerikx M, Kerkhoven RM, Madiredjo M, Nijkamp W, Weigelt B, Agami R, Ge W, Cavet G, Linsley PS, Beijersbergen RL, Bernards R. A large-scale RNAi screen in human cells identifies new components of the p53 pathway. Nature. 2004;428:431–437. - PubMed
    1. Downward J. Use of RNA interference libraries to investigate oncogenic signalling in mammalian cells. Oncogene. 2004;23:8376–8383. - PubMed

MeSH terms