. 2009 Feb;38(1):263-73.
doi: 10.1093/ije/dyn147. Epub 2008 Aug 1.

Size matters: just how big is BIG?: Quantifying realistic sample size requirements for human genome epidemiology

Affiliations

Size matters: just how big is BIG?: Quantifying realistic sample size requirements for human genome epidemiology

Paul R Burton et al. Int J Epidemiol. 2009 Feb.

Abstract

Background: Despite earlier doubts, a string of recent successes indicates that if sample sizes are large enough, it is possible-both in theory and in practice-to identify and replicate genetic associations with common complex diseases. But human genome epidemiology is expensive and, from a strategic perspective, it is still unclear what 'large enough' really means. This question has critical implications for governments, funding agencies, bioscientists and the tax-paying public. Difficult strategic decisions with imposing price tags and important opportunity costs must be taken.

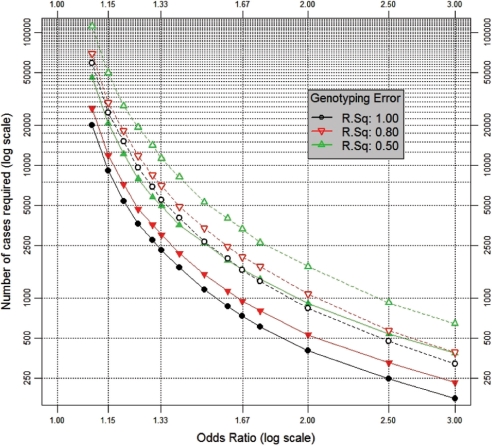
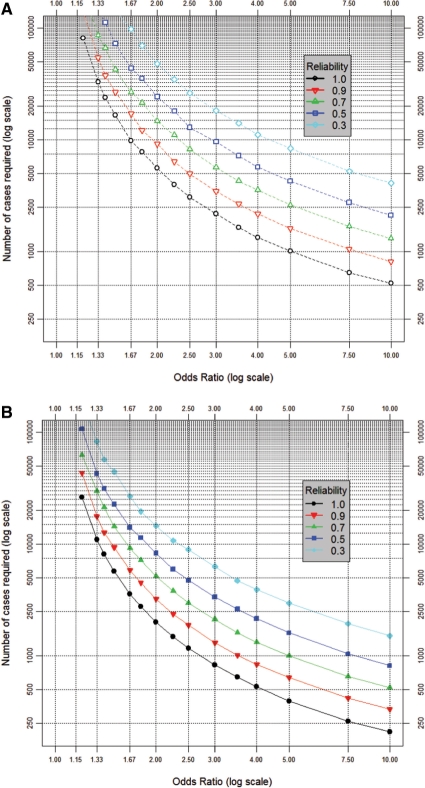
Methods: Conventional power calculations for case-control studies disregard many basic elements of analytic complexity-e.g. errors in clinical assessment, and the impact of unmeasured aetiological determinants-and can seriously underestimate true sample size requirements. This article describes, and applies, a rigorous simulation-based approach to power calculation that deals more comprehensively with analytic complexity and has been implemented on the web as ESPRESSO: (www.p3gobservatory.org/powercalculator.htm).

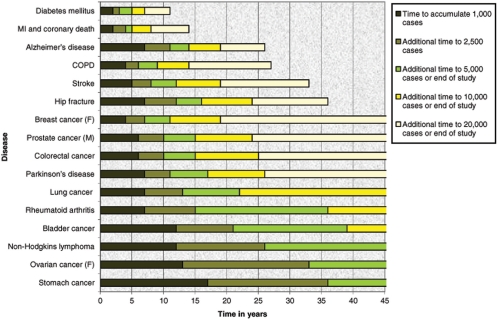
Results: Using this approach, the article explores the realistic power profile of stand-alone and nested case-control studies in a variety of settings and provides a robust quantitative foundation for determining the required sample size both of individual biobanks and of large disease-based consortia. Despite universal acknowledgment of the importance of large sample sizes, our results suggest that contemporary initiatives are still, at best, at the lower end of the range of desirable sample size. Insufficient power remains particularly problematic for studies exploring gene-gene or gene-environment interactions. Discussion Sample size calculation must be both accurate and realistic, and we must continue to strengthen national and international cooperation in the design, conduct, harmonization and integration of studies in human genome epidemiology.


Figures

Figure 1
Figure 1
A genetic main effect, in a candidate gene study. The number of cases required to detect ORs from 1.1 to 3.0 for a genetic main effect with a power of 80% (at P < 0.0001—assuming a vague candidate gene) in a study with four controls per case. Assumptions (see Materials and methods section for details): (i) population genotypic prevalence = 9.75% [dashed lines] or 51% [solid lines], corresponding to dominant SNP effects with MAFs (minor allele frequencies) of 5 and 30%, respectively; (ii) genotypic ‘error’ corresponding to: R2 = 1.0, 0.8 or 0.5; (iii) case-status determined with sensitivity 89.1% and specificity 97.4%: as for a study of diabetes diagnosed by a composite test (GP diagnosis or HbA1C ≥2 SD above the population mean); (iv) controls phenotypically assessed in the same way as cases; (v) incorporation of heterogeneity in the baseline risk of disease arising from unmeasured determinants, corresponding in magnitude to a 10-fold risk ratio between individuals on the high (95%) and low (5%) centiles of population risk
Figure 2
Figure 2
(A) An uncommon interaction. The number of cases required to detect ORs from 1.2 to 10.0 for a gene–environment interaction with a power of 80% (at P < 10−4) in a study with four controls per case. Assumptions (see Materials and methods section for details): (i) population genotypic prevalence = 9.75%, corresponding to a dominant SNP effect with a MAF of 5%; (ii) population prevalence of binary environmental determinant = 20%; (iii) genotypic ‘error’ corresponding to r2 = 0.8; (iv) environmental error corresponding to dichotomization of an underlying normally distributed latent quantitative variable measured with a reliability of 100, 90, 70, 50 or 30%; (v) case–control status determined with sensitivity 89.1% and specificity 97.4%: as for a study of diabetes diagnosed by a composite test (GP diagnosis or HbA1C ≥2 SD above the population mean); (vi) controls phenotypically assessed in the same way as cases; (vii) incorporation of heterogeneity in the baseline risk of disease arising from unmeasured determinants, corresponding in magnitude to a 10-fold risk ratio between individuals on the high (95%) and low (5%) centiles of population risk. The prevalences of the ‘at risk’ genotype and the ‘at risk’ environmental determinant imply a prevalence of ∼2% for the doubly ‘at risk’ interaction. (B) A common interaction. As (A), but assuming: population genotypic prevalence = 51% (corresponding to MAF = 30%) and prevalence of the environmental determinant = 50%, implying prevalence of the doubly ‘at risk’ interaction ∼25%
Figure 3
Figure 3
Time to achieve required numbers of cases. The expected rate of generation of incident cases of 16 common complex diseases (MI = myocardial infarction; COPD = chronic obstructive pulmonary disease) in a cohort of 500 000 men and women recruited over 5 years, aged 40–69 years at baseline, assuming rates of mortality and morbidity as in the UK and that drop-out mirrors that of the British 1958 birth cohort and with adjustment for the ‘healthy cohort’ effect (for full details see)

Comment in

  • Commentary: How small is small?
    Day N. Day N. Int J Epidemiol. 2009 Feb;38(1):274-5. doi: 10.1093/ije/dyn232. Epub 2008 Nov 3. Int J Epidemiol. 2009. PMID: 18984600 No abstract available.

References

    1. World Health Organization (WHO) Geneva: Joint WHO/FAO Expert Consultation; 2005. Diet, Nutrition and the Prevention of Chronic Diseases. The Aethiology of these Diseases.
    1. O’Rahilly S, Wareham NJ. Genetic variants and common diseases–better late than never. N Engl J Med. 2006;355:306–8. - PubMed
    1. Lander ES. The new genomics: global views of biology. Science. 1996;274:536–39. - PubMed
    1. Cargill M, Daley GQ. Mining for SNPs: putting the common variants–common disease hypothesis to the test. Pharmacogenomics. 2000;1:27–37. - PubMed
    1. Reich DE, Lander ES. On the allelic spectrum of human disease. Trends Genet. 2001;17:502–10. - PubMed

Publication types