. 2008 Oct;95(8):3767-89.
doi: 10.1529/biophysj.108.130419. Epub 2008 Aug 1.

Calsequestrin-mediated mechanism for cellular calcium transient alternans

Affiliations

Calsequestrin-mediated mechanism for cellular calcium transient alternans

Juan G Restrepo et al. Biophys J. 2008 Oct.

Erratum in

Abstract

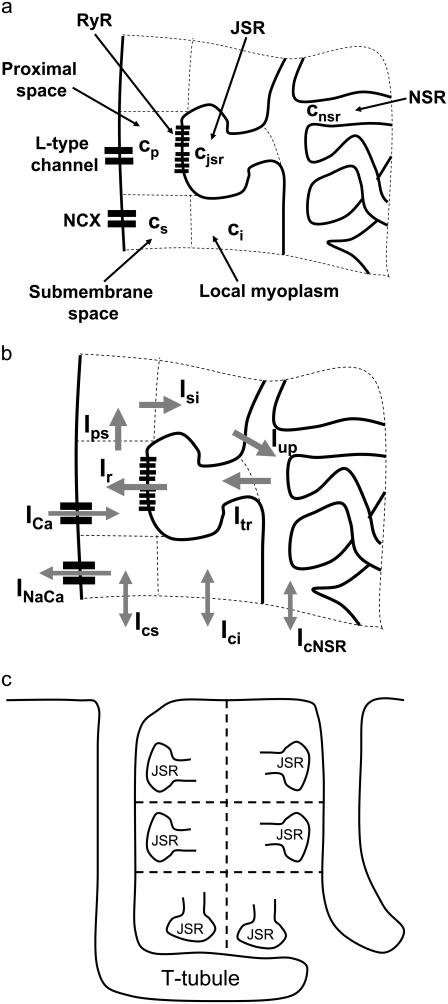
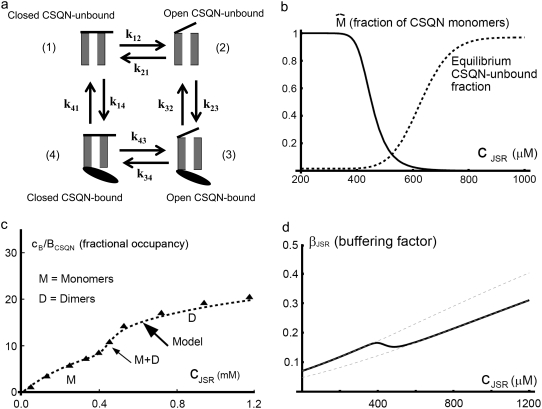
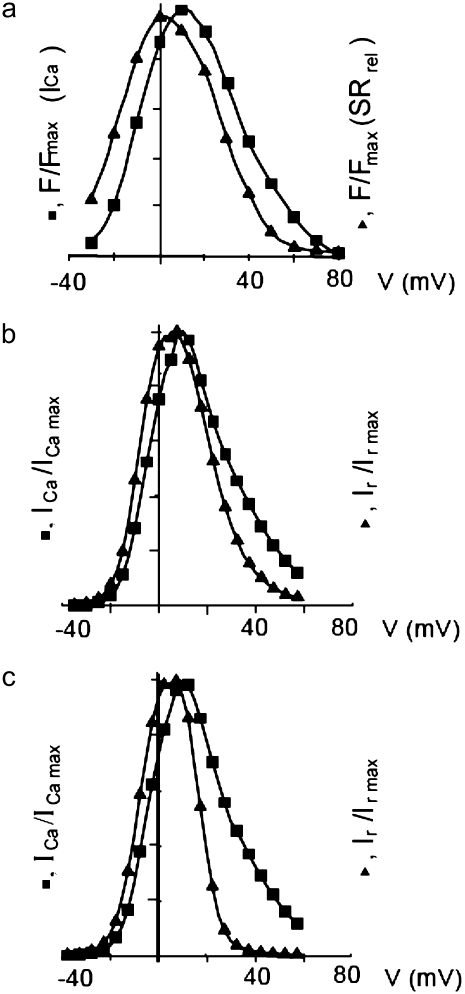
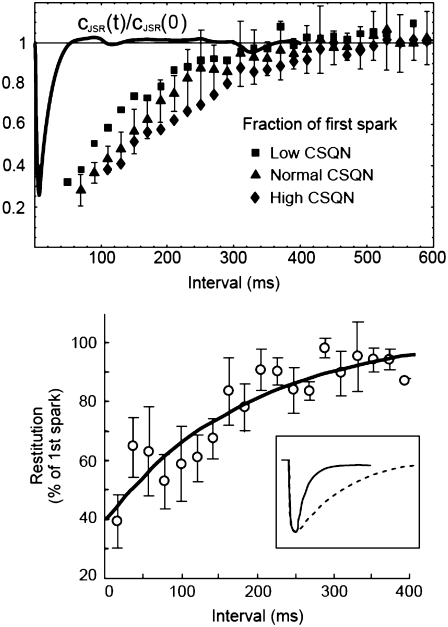
Intracellular calcium transient alternans (CTA) has a recognized role in arrhythmogenesis, but its origin is not yet fully understood. Recent models of CTA are based on a steep relationship between calcium release from the sarcoplasmic reticulum (SR) and its calcium load before release. This mechanism alone, however, does not explain recent observations of CTA without diastolic SR calcium content alternations. In addition, nanoscopic imaging of calcium dynamics has revealed that the elementary calcium release units of the SR can become refractory independently of their local calcium content. Here we show using a new physiologically detailed mathematical model of calcium cycling that luminal gating of the calcium release channels (RyRs) mediated by the luminal buffer calsequestrin (CSQN) can cause CTA independently of the steepness of the release-load relationship. In this complementary mechanism, CTA is caused by a beat-to-beat alternation in the number of refractory RyR channels and can occur with or without diastolic SR calcium content alternans depending on pacing conditions and uptake dynamics. The model has unique features, in that it treats a realistic number of spatially distributed and diffusively coupled dyads, each one with a realistic number of RyR channels, and that luminal CSQN buffering and gating is incorporated based on experimental data that characterizes the effect of the conformational state of CSQN on its buffering properties. In addition to reproducing observed features of CTA, this multiscale model is able to describe recent experiments in which CSQN expression levels were genetically altered as well as to reproduce nanoscopic measurements of spark restitution properties. The ability to link microscopic properties of the calcium release units to whole cell behavior makes this model a powerful tool to investigate the arrhythmogenic role of abnormal calcium handling in many pathological settings.


Figures

FIGURE 1
FIGURE 1
(a) Structure of an elementary Ca2+ release unit (CRU). Each unit consists of local cytosolic, submembrane, proximal, JSR, and NSR compartments. L-type Ca2+ channels release Ca2+ into the proximal space and the sodium-calcium exchange current acts on the submembrane space. (b) Currents in a CRU. The arrows illustrate the average direction of Ca2+ flow. The form of the currents is detailed in the Appendix. (c) Schematic illustration of the heterogeneous orientation of the T-tubules inside the myocyte. The dyadic junctions are oriented along the T-tubules.
FIGURE 2
FIGURE 2
(a) Schematic representation of the four-state Markov model representing the four possible states of a RyR channel: closed CSQN-unbound (1), open CSQN-unbound (2), open CSQN-bound (3), and closed CSQN-bound (4). (b) Fraction of monomers formula image (solid line), and equilibrium value of the CSQN-unbound fraction of RyR channels (dashed line), as a function of the JSR free Ca2+ concentration cJSR. (c) Fractional occupancy, cB/BCSQN, as a function of free Ca2+, cJSR. Experimental values for cardiac CSQN from Park et al. (42) (triangles, solid line), and corresponding theoretical prediction from Eq. 14 (dashed line). (d) Buffering factor βJSR(cJSR) (thick solid line), and the buffering factors that result from assuming that n = nM or n = nD (thin dashed lines) as a function of cJSR.
FIGURE 3
FIGURE 3
(a) Peak L-type Ca2+ current (squares, rightmost curves) and peak SR release current (triangles, leftmost curves) measured in Wier et al. (67) upon depolarization to various test voltages (horizontal axis). (b) Same quantities obtained with our model, including heterogeneity in the proximal volumes, i.e., formula image = 1.26 × 10⁻² μm3(1 + r(n)), where r(n) is a random number, different for each CRU. (c) Same as in panel b, but with no heterogeneity in the proximal volumes, i.e., formula image
FIGURE 4
FIGURE 4
(Top) Average amplitude of a spark as a function of the time elapsed after a previous spark occurred in the same CRU for low (squares), normal (triangles, solid line), and high (diamonds) CSQN concentration. The points were grouped in 20-ms intervals; the error bars are the standard deviation in each group for normal CSQN. The horizontal dashed line indicates full spark amplitude recovery. In qualitative agreement with experiments, higher CSQN prolongs the spark refractory period. The solid line is a typical normalized JSR depletion curve, cJSR(t)/cJSR(0), showing that the recovery from refractoriness is not associated with local JSR refilling. (Bottom) Experimental results from Brochet et al. (43).
FIGURE 5
FIGURE 5
SR depletion, 100 × ((formula imageformula image)/formula image as a function of the initial free Ca2+ SR load, formula image A strong nonlinear increase in release for loads larger than formula image∼ 600 μM is observed.
FIGURE 6
FIGURE 6
(a) Averaged cytosolic Ca2+ concentration ci; (b) calcium current ICa; and (c) sodium-calcium exchanger current INaCa as a function of time for a pacing period T = 400 ms showing no CTA.
FIGURE 7
FIGURE 7
(Top) Averaged cytosolic Ca2+ concentration ci as a function of time for a pacing period T = 220 ms showing CTA. (Bottom) Proximal Ca2+ concentration along a transversal line (27 CRUs) showing how the CTA results from noisy individual signals. In the interval shown, there are dyads firing only in the beats with large ci, every beat, and irregularly, examples of which are indicated with the horizontal arrows and marked as a, b, and c, respectively.
FIGURE 8
FIGURE 8
(a) Peak averaged cytosolic Ca2+ concentration ci on alternate beats during steady-state pacing as a function of pacing period T. A transition to CTA occurs as the pacing period is decreased. (b) Free SR content in mM (dashed line) and the fraction of CSQN-unbound RyR channels in the myocyte, f (solid line) as a function of time for the original parameters. SR release alternans are accompanied by diastolic SR alternans. (c) Free SR content cSR in mM (dashed line) and the fraction of CSQN-unbound RyR channels in the myocyte with modified parameters, f (solid line) as a function of time. Although there are SR release alternans, no significant diastolic SR alternans are present (see discussion in text).
FIGURE 9
FIGURE 9
Diastolic SR content (circles) and fraction of CSQN-unbound channels f (triangles) at steady state pacing as a function of the pacing period T for the modified parameters used in Fig 8 (c).
FIGURE 10
FIGURE 10
Functions used in the map analysis: R(l, f) is the amount by which the SR content decreases as a function of the load l and fraction of CSQN-unbound fraction f, and U(l) is the amount of uptaken Ca2+ after the load decreases to l after release.
FIGURE 11
FIGURE 11
(a) Maximum averaged cytosolic Ca2+ concentration ci on alternate beats during steady-state pacing as a function of the coupling strength scaling factor ξ. The parameter ξ scales all the nearest-neighbor diffusive timescales (i.e., τξτ). Stronger coupling promotes CTA. (b) Maximum averaged cytosolic Ca2+ concentration ci on alternate beats during steady-state pacing as a function of the unbinding time τu. Larger unbinding time promotes CTA. (c) Maximum averaged cytosolic Ca2+ concentration ci on alternate beats during steady-state pacing as a function of the concentration of CSQN sites. A larger concentration of CSQN sites promotes CTA. When not varied, the parameter values are τu = 125 ms, [CSQN] = 400 μM, and ξ = 0.4.
FIGURE 12
FIGURE 12
Proximal Ca2+ concentration along a transversal line of 10 CRUs for large (top, ξ = 0.4) and low diffusive coupling (bottom, ξ = 2.0). Large coupling promotes CRU firing synchronization, while for low coupling CRUs fire more independently. The arrows on top indicate pacing, with period T = 300 ms.

References

    1. Weiss, J. N., A. Karma, Y. Shiferaw, P. S. Chen, A. Garfinkel, and Z. Qu. 2006. From pulsus to pulseless: the saga of cardiac alternans. Circ. Res. 98:1244–1253. - PubMed
    1. Chudin, E., J. Goldhaber, A. Garfinkel, J. Weiss, and B. Kogan. 1999. Intracellular Ca2+ dynamics and the stability of ventricular tachycardia. Biophys. J. 77:2930–2941. - PMC - PubMed
    1. Karma, A. 1994. Electrical alternans and spiral wave breakup in cardiac tissue. Chaos. 4:461–472. - PubMed
    1. Pastore, J. M., S. D. Girouard, K. R. Laurita, F. G. Akar, and D. S. Rosenbaum. 1999. Mechanism linking T-wave alternans to the genesis of cardiac fibrillation. Circulation. 99:1385–1394. - PubMed
    1. Estes, N. A. M., G. Michaud, D. P. Zipes, N. ElSherif, F. J. Venditti, D. S. Rosenbaum, P. Albrecht, P. J. Wang, and R. J. Cohen. 1997. Electrical alternans during rest and exercise as predictors of vulnerability to ventricular arrhythmias. Am. J. Cardiol. 80:1314–1318. - PubMed

Publication types