. 2008 Aug 1;22(15):2125-38.
doi: 10.1101/gad.468508.

A highly conserved molecular switch binds MSY-3 to regulate myogenin repression in postnatal muscle

Affiliations

A highly conserved molecular switch binds MSY-3 to regulate myogenin repression in postnatal muscle

Libera Berghella et al. Genes Dev. .

Abstract

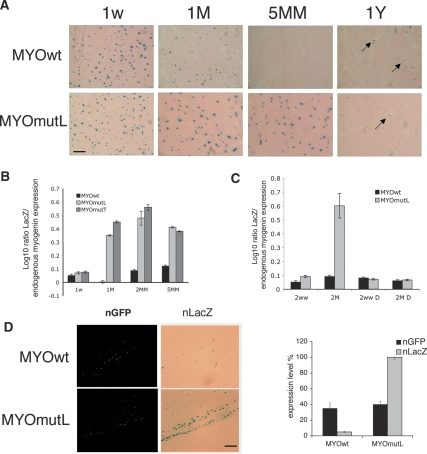
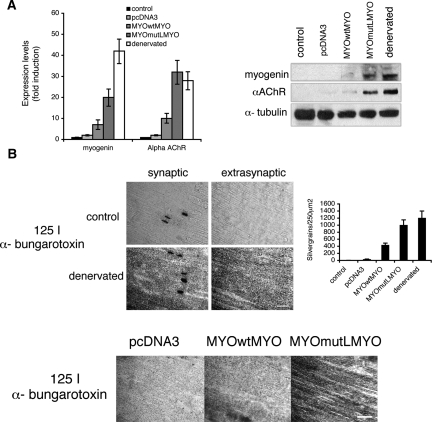
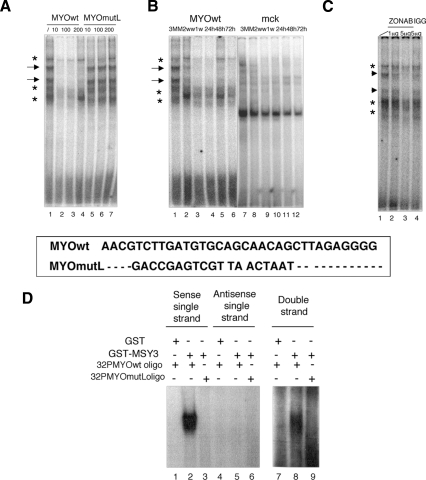
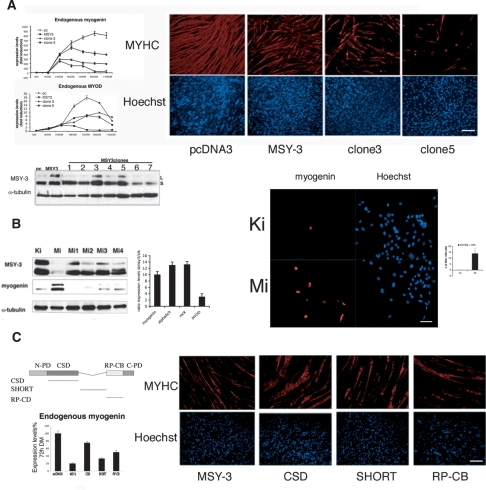
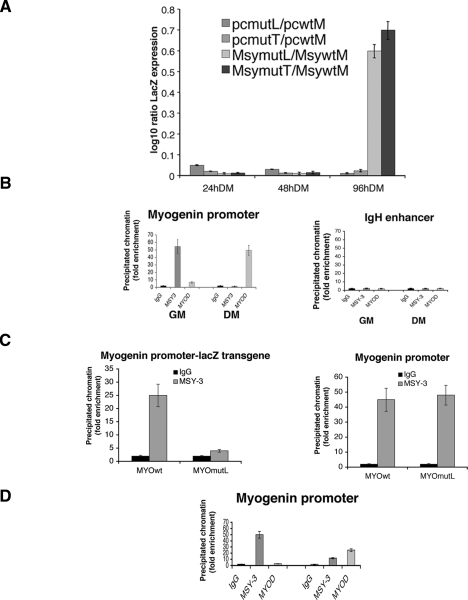
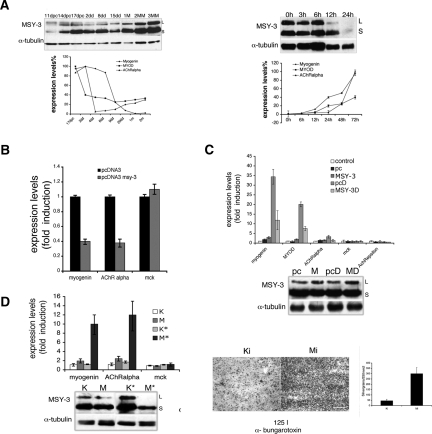
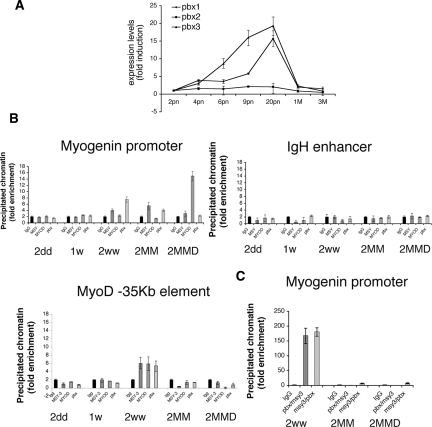
Myogenin is the dominant transcriptional regulator of embryonic and fetal muscle differentiation and during maturation is profoundly down-regulated. We show that a highly conserved 17-bp DNA cis-acting sequence element located upstream of the myogenin promoter (myogHCE) is essential for postnatal repression of myogenin in transgenic animals. We present multiple lines of evidence supporting the idea that repression is mediated by the Y-box protein MSY-3. Electroporation in vivo shows that myogHCE and MSY-3 are required for postnatal repression. We further show that, in the C2C12 cell culture system, ectopic MSY-3 can repress differentiation, while reduced MSY-3 promotes premature differentiation. MSY-3 binds myogHCE simultaneously with the homeodomain protein Pbx in postnatal innervated muscle. We therefore propose a model in which the myogHCE motif operates as a switch by specifying opposing functions; one that was shown previously is regulated by MyoD and Pbx and it specifies a chromatin opening, gene-activating function at the time myoblasts begin to differentiate; the other includes MYS-3 and Pbx, and it specifies a repression function that operates during and after postnatal muscle maturation in vivo and in myoblasts before they begin to differentiate.


Figures

Figure 1.
Figure 1.
MyogHCE mediates myogenin RNA levels during postnatal muscle maturation. (A) β-gal-stained leg muscle of transgenic mice carrying reporter driven by wild-type myogenin promoter (MYOwt) or mutant at myogHCE (MYOmutL). Mouse ages were postnatal 1 wk (1w), 1 or 5 mo (1M, 5MM), or 1 yr (1Y). Bar, 400 μm. (B) Measurements of the expression level of the transgene LacZ by qRT–PCR in leg muscle of transgenic mice carrying the wild-type myogenin promoter (MYOwt) or mutant at myogHCE (MYOmutL, MYOmutT). Mouse ages were postnatal 1 wk (1w) and 1, 2, or 5 mo (1M, 2MM, 5MM). The expression level is normalized by the endogenous myogenin. Each point derives from RNA isolated from three independent transgenic mice. (C) Measurements of the expression level of the transgene LacZ by qRT–PCR in control or denervated (D) leg muscles of transgenic mice carrying the wild-type myogenin promoter (MYOwt) or mutant at myogHCE (MYOmutL). Mouse ages were postnatal 1 wk (1w) and 2 mo (2MM). The expression level is normalized by the endogenous myogenin. Expression levels of LacZ are reported in Supplemental Figure 4. Each point derives from RNA isolated from three independent transgenic lines. (D) β-gal-stained leg muscle of 2-mo-old mice, previously electroporated with constructs carrying reporter driven by wild-type myogenin promoter (MYOwt) or mutant at myogHCE (MYOmutL) and nuclear GFP. Bar, 400 μm. Panels at the left indicates the GFP positive and on the right the LacZ positive nuclei. The graph shows the expression levels of electroporated LacZ transgene and nGFP measured by qRT–PCR.
Figure 2.
Figure 2.
MyogHCE controls AChRs extrasynaptic expression during postnatal muscle maturation. (A) Measurements of the myogenin and AChR α transcripts by qRT-PCR and immunoblot in leg muscle of 2-mo-old mice (control), after 48 h from denervation (denervated), or electroporated with constructs carrying myogenin cDNA driven by 1.1-kb wild-type myogenin promoter (MYOwtMYO) or mutant at myogHCE (MYOmutLMYO), or an empty pcDNA3 vector. Statistical significance of AChR α transcripts measurements in mutant MYOmutLMYO and in the denervated is P > 0.05. (B) The images show the AChRs density visualized by autoradiography of longitudinal sections from tibialis anterior muscle innervated (control) or 48-h denervated muscle in synaptic and extrasynaptic fiber segments (3 mm from the synaptic junctions) (top) or in extrasynaptic fiber segments (3 mm from the synaptic junctions) of tibialis anterior muscle electroporated with an empty pcDNA3 vector, myogenin cDNA driven by the wild-type myogenin promoter (MYOwtMYO) or the mutant at myogHCE (MYOmutLMYO) incubated with 125I-α-bungarotoxin (bottom). The sections were subsequently covered with a monolayer of photographic emulsion and after exposure and development silver grains were counted in 250-μm2 fields along the length of the sections, 3 mm on each side of the synapse (graph). The areas of high grain density in the left top panels correspond to the end-plate region of the fibers. Bar, 400 μm.
Figure 3.
Figure 3.
Innervation-sensitive complexes require the myogHCE element. MSY-3-binding specificity. (A) Protein-binding complexes formed in vitro (arrows), assayed by EMSA, are detected on myogHCE oligo from muscle nuclear extracts of 3-mo-old mice. Labeled MYOwt oligo competed with 10–100–200× excess of cold competitor wild type (MYOwt, lanes 2–4) or mutated (MYOmutL, lanes 5–7), as indicated. Oligo sequences are shown in the box. (B) EMSA complexes (arrows) at myogHCE from nuclear extracts 3-mo-old mice (lane 1) are absent from nuclear extracts of 2 and 1 wk (lanes 2,3) and from nuclear extracts of 3-mo-old mice denervated 24, 48, and 72 h before (lanes 4–6). Control MCK promoter EMSA (lanes 7–12) shows specific complex from all samples. (C) EMSA of nuclear extracts of muscle of 3-mo-old mice with myogHCE 32P-labeled oligonucleotide in the presence of ZONAB antibody (lanes 2,3, 1–5 μg) or control IgG (lane 4, 5 μg). Arrows indicate the specific, asterisks indicate the nonspecific, and arrowheads the immunocompeted mobility shift maturation-innervation dependent protein complexes. (D) EMSA assay of GST and GST-MSY-3 fusion protein with myogHCE 32P-labeled oligonucleotide in single strand forms (lanes 1,2 sense; lanes 4,5 antisense) and in a double strand (lanes 7, 8) and GST-MSY-3 protein with mutant myogHCE 32P-labeled oligonucleotides MYOmutL in single strand forms (lane 3, sense; lane 4, antisense) and in a double strand form (lane 9).
Figure 4.
Figure 4.
Evidence MSY-3 inhibits myogenesis. (A) MSY-3 transfections of C2C12 myogenic cells. Expression during myogenic differentiation of endogenous myogenin and MyoD measured by qRT–PCR of mock-transfected (pc) and a MSY-3-transfected (MSY-3) C2C12 multiclonal populations, and two MSY-3-transfected clones (3 and 5). Immunoblot of extracts from MSY-3-overexpressing C2C12 clones blotted with ZONAB (MSY-3 Ab) and α-tubulin control. Two MSY-3 isoforms, short (S) and long (L). Myosin heavy chain Ab marks differentiation (left) and Hoechst (right) stains of nuclei of the same C2C12 multiclone populations and clones 3, 5 at 72 h in DM (full differentiation). Bar, 400 μm. (B) Effects of MSY-3 knockdown by siRNA. The immunoblot shows the two isoforms of MSY-3 protein in extracts from C2C12 in GM, transfected with a pool of four interfering oligos (MiSmart) against MSY-3; or single oligos (Mi1, Mi2, Mi3, Mi4), compared with control oligos (KiSmart). Levels of myogenin are reported and normalized relative to α-tubulin. Left graph shows the ratio of myogenin, MyoD, α AChR subunit, and MCK between the C2C12 in GM blocked with MSY-3 siRNA (MiSmart) or with control siRNAs (KiSmart). GAPDH was used to normalize. Anti myogenin Ab (left panel) and Hoechst (right) staining of control siRNA (KiSmart) or MSY-3 siRNA (MiSmart). Bar, 200 μm. Graph quantifies myogenin positive C2C12 nuclei in growth medium. (C) Mutational analysis of MSY-3 protein. C2C12-transformed cell lines overexpressing mutated forms of HA-tagged MSY-3 protein were derived. In Supplemental Figure 10A expression of MSY-3-HA tagged in MSY-3 wild-type and mutant polyclone populations is shown. Domain structure of MSY-3 protein and mutated forms derived N-PD (N-terminal proline-rich domain), CSD (cold-shock domain), SHORT (splicing alternative domain), RP-CB (arginine- and proline-rich conserved domain), C-PD (C-terminal praline-rich domain). The graph indicates the expression level of endogenous myogenin in the clones overexpressing the wild-type MSY-3 protein, and the mutated forms in the CSD, SHORT, and the RP-CB domain. Myosin heavy chain Ab marks differentiation (top) and Hoechst (bottom) stains nuclei of the same C2C12 multiclone populations at 72 h in DM (full differentiation). Bar, 400 μm.
Figure 5.
Figure 5.
MSY-3 requires myoHCE to repress myogenin reporter and binds in vivo at myogenin promoter. (A) Measurements of LacZ transgene reporter by qRT–PCR in C2C12 clones. LacZ is under the control of the wild-type myogenin promoter (pcMwt, MsyMwt) or mutated variants (pcmutL, MsymutL pcmutT, MsymutT) in mock-transfected (pc) and MSY-3-overexpressing (Msy) C2C12 cells. Expression level reported as log ratio of LacZ mutated/wild type, normalized by endogenous myogenin. Neomycin and puromycin expression markers used to check that transgene incorporation levels were similar. (B) ChIP analysis for MSY-3 and MyoD. Control IgG, MSY-3, and MyoD antibodies were used individually to enrich fixed chromatin from undifferentiated (GM) or differentiated (DM) C2C12 cells. qRT–PCR is used to quantify sequences from the myogenin promoter and the negative control IgH enhancer. (C) Chromatin from multiclone populations carrying LacZ under MYO and MYOL promoter control growth in GM. qRT-PCR used to quantify for the ectopic myogenin promoter-LacZ fragment (left) and the endogenous myogenin promoter (right). (D) Chromatin from undifferentiated C2C12 transfected with the pool of four interfering oligos (Mi) that knocks down MSY-3 or control oligos (Ki). Figure displays results representative from three independent ChIP experiments.
Figure 6.
Figure 6.
MSY-3 in adult muscle innervation. (A) Expression of MSY-3 protein and myogenin, MyoD and AChR α subunit RNA in muscle at different times of maturation (immunoblot and graph, left) and after denervation by sciatic nerve transection (immunoblot and graph, right). (B) Expression of myogenin and AChR α subunit genes after electroporation in tibialis anterior and quadriceps muscle of young mice (14 d postnatal) of the control (pcDNA3) and MSY-3 (pcDNA3-MSY-3) constructs evaluated by qRT–PCR. (C) Expression of myogenin, MyoD, AChR α subunit, MCK, and AChR ε in adult (2 mo) tibialis anterior muscle (control) electroporated with pcDNA3 (pc); electroporated with MSY-3 (MSY-3); electroporated with the same constructs and later denervated by sciatic nerve transection (pcD and MSY-3D). Expression was evaluated by qRT–PCR and immunoblot (MSY-3). (D, left) Expression of myogenin, AChR α subunit, and MCK in tibialis anterior muscle of adult mice (2 mo) elecroporated with a pool of four interfering oligos (Mi), which blocks MSY-3 or with control oligos (Ki), coinjected with a nuclear GFP-expressing plasmid (Mi* and Ki*) in order to dissect only the injected area and evaluated by qRT–PCR. The immunoblot measures MSY-3 expression. (Right) AChRs density in extrasynaptic regions (3 mm from synaptic junctions) visualized by autoradiography of longitudinal sections from Ki* or Mi* electroporated tibialis anterior muscle of adult mice (2 mo old) and incubated with 125 I-α-bungarotoxin. Bar, 200 μm.
Figure 7.
Figure 7.
MSY-3 and Pbx binding to the myogHCE region in vivo. (A) Expression of three isoforms of Pbx in muscle at different times of maturation are evaluated by qRT–PCR. (B) ChIP analysis with control IgG, MSY-3, MyoD, and Pbx antibodies on chromatin from tibialis anterior muscle of young (2dd, 1w, and 2ww); adult (2MM); or denervated (2MMD) mice. Following immunoprecipitation, DNA enrichment was measured by qRT–PCR for myogenin promoter (top left), control IgH enhancer (top right), or −35-kb MyoD enhancer (bottom). (C) A sequential ChIP (RE-ChIP) experiment. Chromatin immunoprecipitated with MSY-3 was reincubated with anti Pbx (Pbx/MSY-3) or vice-versa (MSY-3 then Pbx). Results shown are representative of three independent experiments.

Similar articles

Cited by

References

    1. Berberich C., Durr I., Koenen M., Witzemann V. Two adjacent E box elements and a M-CAT box are involved in the muscle-specific regulation of the rat acetylcholine receptor beta subunit gene. Eur. J. Biochem. 1993;216:395–404. - PubMed
    1. Berkes C.A., Bergstrom D.A., Penn B.H., Seaver K.J., Knoepfler P.S., Tapscott S.J. Pbx marks genes for activation by MyoD indicating a role for a homeodomain protein in establishing myogenic potential. Mol. Cell. 2004;14:465–477. - PubMed
    1. Blagden C.S., Fromm L., Burden S.J. Accelerated response of the myogenin gene to denervation in mutant mice lacking phosphorylation of myogenin at threonine 87. Mol. Cell. Biol. 2004;24:1983–1989. - PMC - PubMed
    1. Blais A., Tsikitis M., Acosta-Alvear D., Sharan R., Kluger Y., Dynlacht B.D. An initial blueprint for myogenic differentiation. Genes & Dev. 2005;19:553–569. - PMC - PubMed
    1. Buonanno A., Apone L., Morasso M.I., Beers R., Brenner H.R., Eftimie R. The MyoD family of myogenic factors is regulated by electrical activity: Isolation and characterization of a mouse Myf-5 cDNA. Nucleic Acids Res. 1992;20:539–544. - PMC - PubMed

Publication types

MeSH terms