. 2008 Aug 1;68(15):6065-73.
doi: 10.1158/0008-5472.CAN-07-5376.

Cyclic AMP response element-binding protein overexpression: a feature associated with negative prognosis in never smokers with non-small cell lung cancer

Affiliations

Cyclic AMP response element-binding protein overexpression: a feature associated with negative prognosis in never smokers with non-small cell lung cancer

Hye-Sook Seo et al. Cancer Res. .

Abstract

Lung cancer is the leading cause of cancer deaths worldwide. Recent advances in targeted therapies hold promise for the development of new treatments for certain subsets of cancer patients by targeting specific signaling molecule. Based on the identification of the transcription factor cyclic AMP response element-binding protein (CREB) as an important regulator of growth of several types of cancers and our recent findings of its importance in normal differentiation of bronchial epithelial cells, we hypothesized that CREB plays an important pathobiologic role in lung carcinogenesis. We conducted this initial study to determine whether the expression and activation status of CREB are altered in non-small cell lung cancer (NSCLC) and of any prognostic importance in NSCLC patients. We found that the expression levels of mRNA and protein of CREB and phosphorylated CREB (p-CREB) were significantly higher in most of the NSCLC cell lines and tumor specimens than in the normal human tracheobronchial epithelial cells and adjacent normal lung tissue, respectively. Analysis of CREB mRNA expression and the CREB gene copy number showed that CREB overexpression occurred mainly at the transcriptional level. Immunohistochemical analysis of tissue microarray slides containing sections of NSCLC specimens obtained from 310 patients showed that a decreased survival duration was significantly associated with overexpression of CREB or p-CREB in never smokers but not in current or former smokers with NSCLC. These are the first reported results illustrating the potential of CREB as a molecular target for the prevention and treatment of NSCLC, especially in never smokers.


Figures

Figure 1
Figure 1
Expression of CREB and p-CREB in NHTBE and NSCLC cells. A, Western blot analysis of CREB and p-CREB expression. Whole-cell lysates were prepared from fully differentiated NHTBE cells (lane 1) and the 10 NSCLC cell lines (lane 2, H226; lane 3, H292; lane 4, H520; lane 5, H2170; lane 6, H1563; lane 7, H1734; lane 8, H1975; lane 9, H2228; lane 10, A549; lane 11, H1703) grown in optimal medium up to confluence. Equal amounts of lysate were subjected to SDS-PAGE and western blotting. The blots were probed with anti-CREB and anti-p-CREB antibodies. Equal protein loading was confirmed by stripping the blots and reprobing them with an anti-β-actin antibody. The expression levels of CREB and p-CREB proteins for each cell line in relative to the NHTBE cells were quantitated and shown below. B, qRT-PCR analysis of CREB mRNA expression. The CREB mRNA level in each cell line was analyzed with qRT-PCR. The values shown are the ratios of the CREB mRNA expressed in NSCLC cells to that expressed in NHTBE cells, with CREB mRNA levels normalized against the GAPDH mRNA level. The results shown are from a representative experiment performed twice, each run in triplicate. The data are expressed as the mean ± standard error (S.E.). *: P < 0.05; **: P < 0.01 versus NHTBE cells (lane 1) with Student’s t-test. C, CREB gene copy number analysis with PCR. The genomic DNA obtained from each cell line was subjected to PCR. The results shown are from a representative experiment performed twice, each run in triplicate. The values are the ratios of the CREB DNA copy number in NSCLC cells to that in NHTBE cells, with CREB DNA normalized against the β-actin DNA level. The data are expressed as the mean ± S.E. *: P < 0.05; **: P < 0.01 versus NHTBE cells (lane 1) with Student’s t-test.
Figure 2
Figure 2
Expression of CREB and p-CREB in frozen human NSCLC specimens and adjacent normal bronchial and bronchiolar epithelial tissue specimens. A, Western blot analysis of CREB and p-CREB expression. Soluble proteins obtained from three squamous cell carcinoma (Sq) and three adenocarcinoma (Ad) tissue specimens (T) and paired matching normal tissue specimens (N) were subjected to western blot analysis for the levels of total CREB and p-CREB expression. Equal protein loading was confirmed by stripping the blots and reprobing them with an anti-β-actin antibody. The expression levels of CREB and p-CREB proteins in tissue specimens in relative to that of the NHTBE cells (hatched bar) were quantitated and shown below. B, qRT-PCR analysis of CREB mRNA expression. Total mRNA from the NSCLC tissue specimens and paired normal tissue specimens described in A was subjected to qRT-PCR. The values shown are the ratios of the CREB mRNA expressed in tissue specimens to that expressed in NHTBE cells, with CREB mRNA levels normalized against the GAPDH mRNA level. The results are from a representative experiment performed twice, and samples were run in triplicate. The data are expressed as the mean ± S.E. *: P < 0.05; **: P < 0.01 versus matched normal tissue with Student’s t-test. C, PCR analysis of CREB gene copy number. The genomic DNA extracted from the NSCLC tissue specimens and paired normal tissue specimens was subjected to qPCR. The values are the ratios of the CREB DNA copy numbers in normal and tumor tissues to the CREB DNA copy numbers in NHTBE cells, with CREB DNA normalized against the β-actin DNA level. The results are from a representative experiment performed twice, and samples were run in triplicate. The data are expressed as the mean ± S.E. *: P < 0.05; **: P < 0.01 versus matched normal tissue with Student’s t-test.
Figure 3
Figure 3
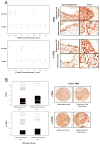
Immunohistochemical analysis of CREB and p-CREB expression in normal and tumor lung tissues. A, Fixed NSCLC tissue specimens (26 adenocarcinoma, 19 squamous cell carcinoma) and adjacent normal bronchial and bronchiolar epithelial tissue specimens were subjected to immunohistochemical staining, and then scored according to the criteria mentioned in Method and Material. BLiP plots displaying the distribution of CREB and p-CREB immunostaining scores in normal and tumor tissues are shown (right). Average scores for CREB are 1.37 in tumor versus 0.73 in normal (P = 0.013) and for p-CREB 1.96 in tumor versus 1.05 in normal (P = 0.0002). Representative Images (left) were captured at a magnification of ×200. Arrows indicate nuclear CREB and p-CREB immunostaining in the basal layer of normal bronchial epithelial and tumor tissue specimens. B, CREB and p-CREB immunostaining of TMA specimens from a total of 310 patients with either adenocarcinoma (194) or squamous cell carcinoma (116) are included in the analysis. The distributions of the staining scores for the two histological types of NSCLC are presented in the box plots (left). The number of samples measured was indicated under each category. X marks and lines inside the quartile boxes are means and medians respectively (for CREB, 0.43 and 0.23 in adenocarcinoma/BAC versus 0.61 and 0.45 in squamous cell carcinoma; for p-CREB, 025 and 0.03 versus 0.32 and 0.2). P = 0.002 for CREB; P = 0.008 for p-CREB. Representative images of CREB and p-CREB immunostaining of TMA NSCLC specimens are shown in the right.(magnification, ×40).
Figure 4
Figure 4
Kaplan-Meier curves of overall survival duration stratified according to CREB (top) and p-CREB (bottom) expression in the entire cohort (left panel) and in never-smokers (right panel). A total of 310 patients had information available for the survival analysis, 94 of whom died. The median overall survival duration was 6.5 years, and the median follow-up duration was 3.2 years. The cut-off points for the CREB and p-CREB immunostaining scores were identified using martingale residual plots with respect to the overall survival duration. The curves are labeled with the corresponding immunostaining scores.

Similar articles

Cited by

References

    1. Kamath AV, Chhajed PN. Role of bronchoscopy in early diagnosis of lung cancer. Indian J Chest Dis Allied Sci. 2006;48:265–9. - PubMed
    1. Jemal A, Siegel R, Ward E, et al. Cancer statistics, 2008. CA Cancer J Clin. 2008;58:71–96. - PubMed
    1. Broker LE, Giaccone G. The role of new agents in the treatment of non-small cell lung cancer. Eur J Cancer. 2002;38:2347–61. - PubMed
    1. Paez JG, Janne PA, Lee JC, et al. EGFR mutations in lung cancer: correlation with clinical response to gefitinib therapy. Science (New York, NY) 2004;304:1497–500. - PubMed
    1. Lynch TJ, Bell DW, Sordella R, et al. Activating mutations in the epidermal growth factor receptor underlying responsiveness of non-small-cell lung cancer to gefitinib. The New England journal of medicine. 2004;350:2129–39. - PubMed

Publication types

Substances