

Impaired dendritic cell function in aging leads to defective antitumor immunity
- PMID: 18676859
- PMCID: PMC2575813
- DOI: 10.1158/0008-5472.CAN-07-5769
Impaired dendritic cell function in aging leads to defective antitumor immunity
Abstract
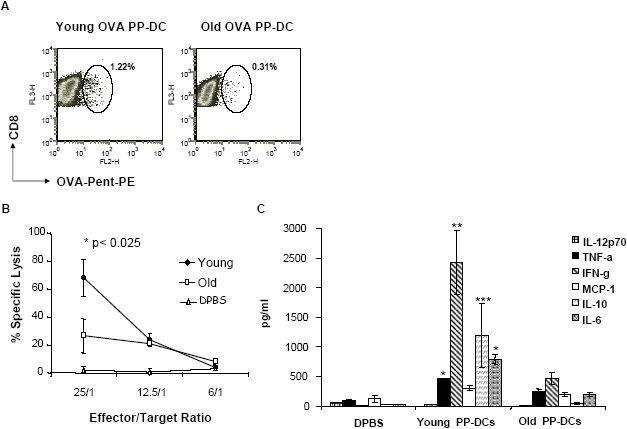
We recently reported that bone marrow-derived dendritic cells (DC) from aged miced are less effective than their young counterparts in inducing the regression of B16-ovalbumin (OVA) melanomas. To examine the underlying mechanisms, we investigated the effect of aging on DC tumor antigen presentation and migration. Although aging does not affect the ability of DCs to present OVA peptide((257-264)), DCs from aged mice are less efficient than those from young mice in stimulating OVA-specific T cells in vitro. Phenotypic analysis revealed a selective decrease in DC-specific/intracellular adhesion molecule type-3-grabbing nonintegrin (DC-SIGN) level in aged DCs. Adoptive transfer experiments showed defective in vivo DC trafficking in aging. This correlates with impaired in vitro migration and defective CCR7 signaling in response to CCL21 in aged DCs. Interestingly, vaccination of young mice using old OVA peptide((257-264))-pulsed DCs (OVA PP-DC) resulted in impaired activation of OVA-specific CD8(+) T cells in vivo. Effector functions of these T cells, as determined by IFN-gamma production and cytotoxic activity, were similar to those obtained from mice vaccinated with young OVA PP-DCs. A decreased influx of intratumor CD8(+) T cells was also observed. Importantly, although defective in vivo migration could be restored by increasing the number of old DCs injected, the aging defect in DC tumor surveillance and OVA-specific CD8(+) T-cell induction remained. Taken together, our findings suggest that defective T-cell stimulation contributes to the observed impaired DC tumor immunotherapeutic response in aging.
Figures


Similar articles
-
Effect of aging on bone marrow-derived murine CD11c+CD4-CD8alpha- dendritic cell function.J Gerontol A Biol Sci Med Sci. 2006 Oct;61(10):1039-47. doi: 10.1093/gerona/61.10.1039. J Gerontol A Biol Sci Med Sci. 2006. PMID: 17077196
-
Strategies for antigen choice and priming of dendritic cells influence the polarization and efficacy of antitumor T-cell responses in dendritic cell-based cancer vaccination.Cancer Immunol Immunother. 2004 Nov;53(11):963-77. doi: 10.1007/s00262-004-0542-8. Epub 2004 May 14. Cancer Immunol Immunother. 2004. PMID: 15146294 Free PMC article.
-
[Enhanced translational efficacy of internal ribosomal entry site-mediated mRNA in dendritic cells contributes to efficient induction of antitumor immunity].Zhonghua Yi Xue Za Zhi. 2007 Feb 6;87(6):399-403. Zhonghua Yi Xue Za Zhi. 2007. PMID: 17456382 Chinese.
-
Mechanisms of murine dendritic cell antitumor dysfunction in aging.Cancer Immunol Immunother. 2009 Dec;58(12):1935-9. doi: 10.1007/s00262-008-0636-9. Epub 2008 Dec 13. Cancer Immunol Immunother. 2009. PMID: 19082999 Free PMC article. Review.
-
Impact of aging on dendritic cell functions in humans.Ageing Res Rev. 2011 Jul;10(3):336-45. doi: 10.1016/j.arr.2010.06.004. Epub 2010 Jul 7. Ageing Res Rev. 2011. PMID: 20619360 Free PMC article. Review.
Cited by
-
A Missing Link: Engagements of Dendritic Cells in the Pathogenesis of SARS-CoV-2 Infections.Int J Mol Sci. 2021 Jan 23;22(3):1118. doi: 10.3390/ijms22031118. Int J Mol Sci. 2021. PMID: 33498725 Free PMC article. Review.
-
A Modular Mathematical Model of the Immune Response for Investigating the Pathogenesis of Infectious Diseases.Viruses. 2025 Apr 22;17(5):589. doi: 10.3390/v17050589. Viruses. 2025. PMID: 40431602 Free PMC article.
-
The efficacy of immune checkpoint inhibitors in elderly patients: a meta-analysis and meta-regression.ESMO Open. 2022 Oct;7(5):100577. doi: 10.1016/j.esmoop.2022.100577. Epub 2022 Sep 23. ESMO Open. 2022. PMID: 36156450 Free PMC article.
-
Immunosenescence in vertebrates and invertebrates.Immun Ageing. 2013 Apr 2;10(1):12. doi: 10.1186/1742-4933-10-12. Immun Ageing. 2013. PMID: 23547999 Free PMC article.
-
In Vitro Interaction Between Yeast Extracellular Vesicles and Human Monocyte-Derived Dendritic Cells.Methods Mol Biol. 2025;2857:137-146. doi: 10.1007/978-1-0716-4128-6_13. Methods Mol Biol. 2025. PMID: 39348062
References
-
- Yung RL. Changes in immune function with age. Rheum Dis Clin North Am. 2000;26:455–73. - PubMed
-
- Miller RA. The aging immune system: primer and prospectus. Science. 1996;273:70–4. - PubMed
-
- Banchereau J, Steinman RM. Dendritic cells and the control of immunity. Nature. 1998;392:245–52. - PubMed
-
- Palucka K, Banchereau J. Dendritic cells: a link between innate and adaptive immunity. J Clin Immunol. 1999;19:12–25. - PubMed
-
- Banchereau J, Palucka AK. Dendritic cells as therapeutic vaccines against cancer. Nat Rev Immunol. 2005;5:296–306. - PubMed
Publication types
MeSH terms
Substances
Grants and funding
LinkOut - more resources
Full Text Sources
Medical
Research Materials
Miscellaneous
