

Estimation of HIV incidence in the United States
- PMID: 18677024
- PMCID: PMC2919237
- DOI: 10.1001/jama.300.5.520
Estimation of HIV incidence in the United States
Abstract
Context: Incidence of human immunodeficiency virus (HIV) in the United States has not been directly measured. New assays that differentiate recent vs long-standing HIV infections allow improved estimation of HIV incidence.
Objective: To estimate HIV incidence in the United States.
Design, setting, and patients: Remnant diagnostic serum specimens from patients 13 years or older and newly diagnosed with HIV during 2006 in 22 states were tested with the BED HIV-1 capture enzyme immunoassay to classify infections as recent or long-standing. Information on HIV cases was reported to the Centers for Disease Control and Prevention through June 2007. Incidence of HIV in the 22 states during 2006 was estimated using a statistical approach with adjustment for testing frequency and extrapolated to the United States. Results were corroborated with back-calculation of HIV incidence for 1977-2006 based on HIV diagnoses from 40 states and AIDS incidence from 50 states and the District of Columbia.
Main outcome measure: Estimated HIV incidence.
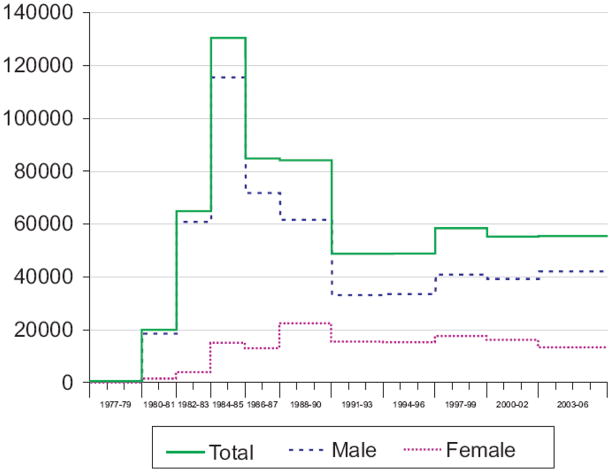
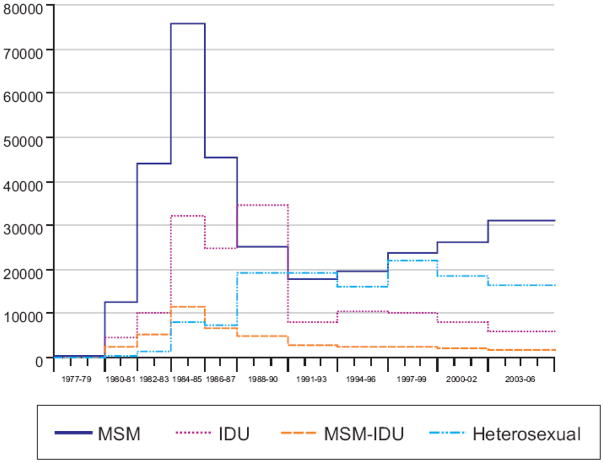
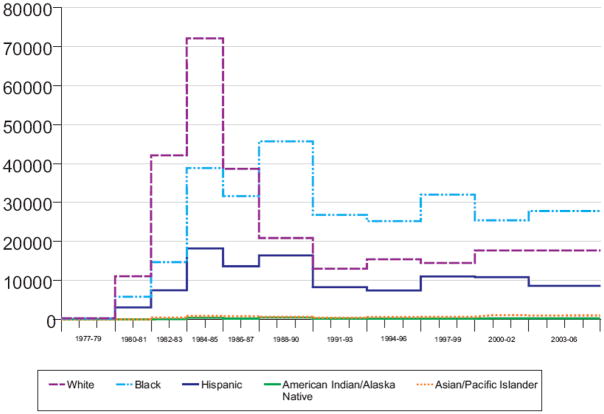
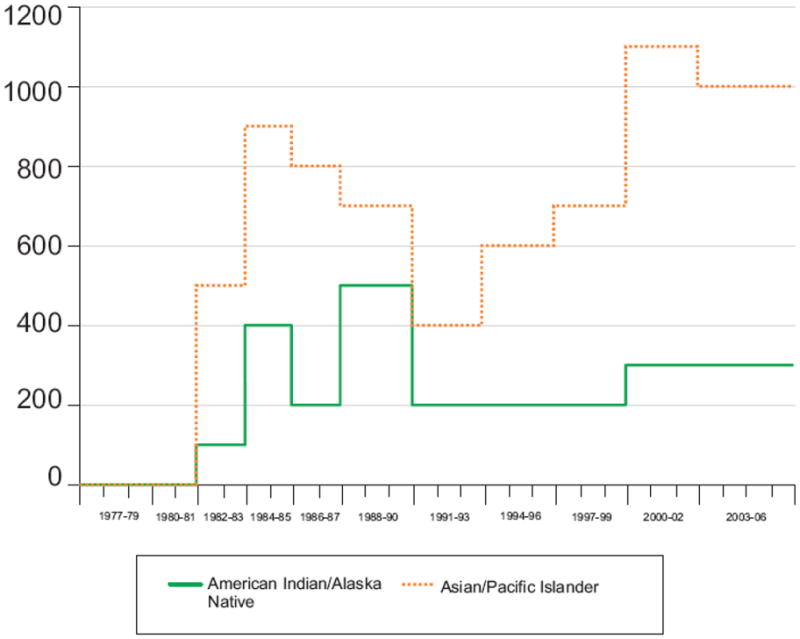
Results: An estimated 39,400 persons were diagnosed with HIV in 2006 in the 22 states. Of 6864 diagnostic specimens tested using the BED assay, 2133 (31%) were classified as recent infections. Based on extrapolations from these data, the estimated number of new infections for the United States in 2006 was 56,300 (95% confidence interval [CI], 48,200-64,500); the estimated incidence rate was 22.8 per 100,000 population (95% CI, 19.5-26.1). Forty-five percent of infections were among black individuals and 53% among men who have sex with men. The back-calculation (n = 1.230 million HIV/AIDS cases reported by the end of 2006) yielded an estimate of 55,400 (95% CI, 50,000-60,800) new infections per year for 2003-2006 and indicated that HIV incidence increased in the mid-1990s, then slightly declined after 1999 and has been stable thereafter.
Conclusions: This study provides the first direct estimates of HIV incidence in the United States using laboratory technologies previously implemented only in clinic-based settings. New HIV infections in the United States remain concentrated among men who have sex with men and among black individuals.
Figures
Comment in
-
Syringe access and HIV incidence in the United States.JAMA. 2008 Nov 26;300(20):2370. doi: 10.1001/jama.2008.707. JAMA. 2008. PMID: 19033586 No abstract available.
References
-
- Institute of Medicine. No time to lose: getting more from HIV prevention. Washington: National Academy of Sciences; 2000.
-
- Biggar RJ, Rosenberg PS. HIV infection/AIDS in the United States during the 1990s. Clinical Infectious Diseases. 1993;(17 Suppl 1):S219–23. - PubMed
-
- Rosenberg P. Backcalculation models of age-specific HIV incidence rates. Statistics in medicine. 1994;(13):1975–90. - PubMed
-
- Rosenberg PS. Scope of the AIDS epidemic in the United States. Science. 1995;270:1372–1375. - PubMed
-
- Brookmeyer R. Reconstruction and future trends of the AIDS epidemic in the United States. Science. 1991;253:37–42. - PubMed
