. 2008 Aug;25(8):1866-74.
doi: 10.1364/josaa.25.001866.

Application of Mie theory to assess structure of spheroidal scattering in backscattering geometries

Affiliations

Application of Mie theory to assess structure of spheroidal scattering in backscattering geometries

Kevin J Chalut et al. J Opt Soc Am A Opt Image Sci Vis. 2008 Aug.

Abstract

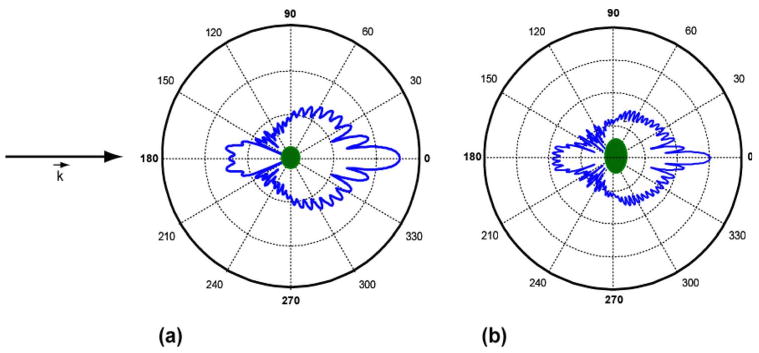
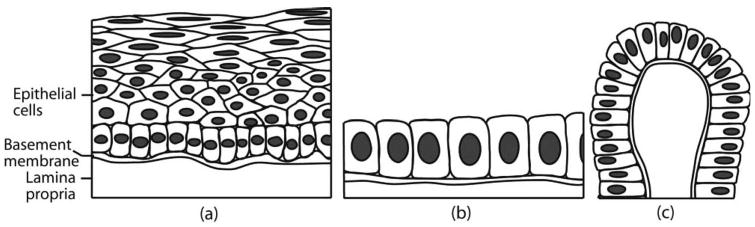
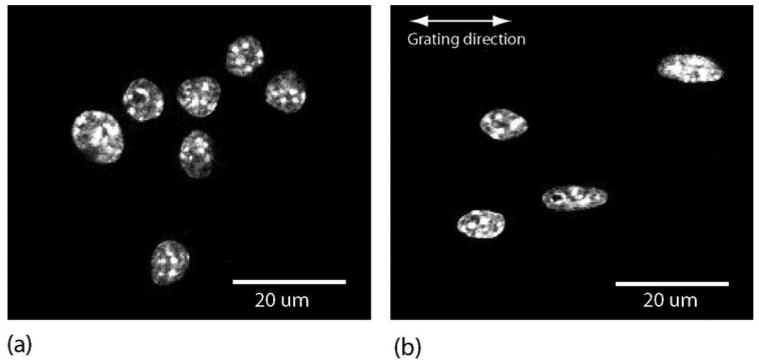
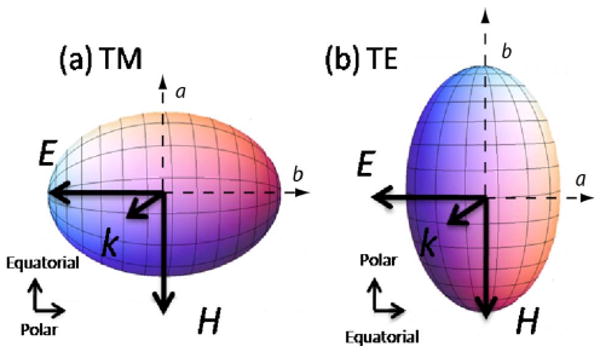
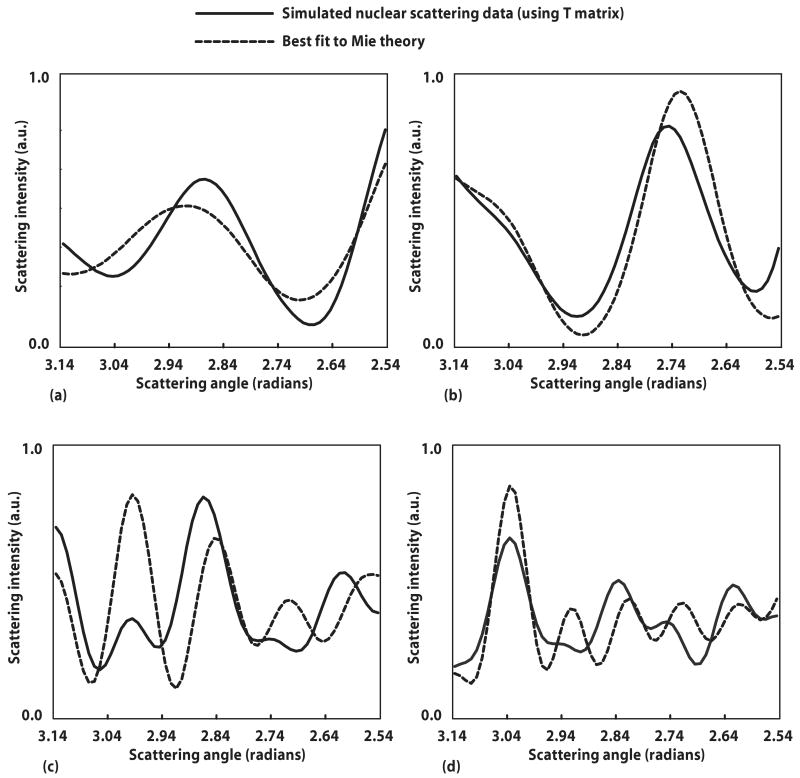
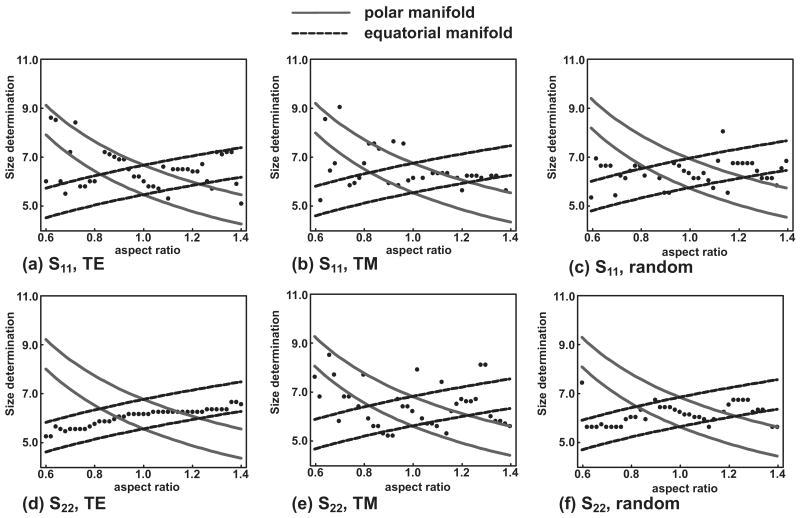
Inverse light scattering analysis seeks to associate measured scattering properties with the most probable theoretical scattering distribution. Although Mie theory is a spherical scattering model, it has been used successfully for discerning the geometry of spheroidal scatterers. The goal of this study was an in-depth evaluation of the consequences of analyzing the structure of spheroidal geometries, which are relevant to cell and tissue studies in biology, by employing Mie-theory-based inverse light scattering analysis. As a basis for this study, the scattering from spheroidal geometries was modeled using T-matrix theory and used as test data. In a previous study, we used this technique to investigate the case of spheroidal scatterers aligned with the optical axis. In the present study, we look at a broader scope which includes the effects of aspect ratio, orientation, refractive index, and incident light polarization. Over this wide range of parameters, our results indicate that this method provides a good estimate of spheroidal structure.


Figures

Fig. 1
Fig. 1
(Color online) Conceptualization of inverse light scattering analysis. Angular scattering distributions are depicted for two different spheroids as calculated by T-matrix theory. For both, the background index of refraction is 1.43 and the scattering index of refraction is 1.59. (a) Equal volume diameter, D=4.0 μm, aspect ratio ε=0.8, (b) D = 7.0 μm, ε=0.6. By measuring scattering properties and comparing to models, structural differences between two objects can be discerned.
Fig. 2
Fig. 2
Stratified squamous (a), simple cuboidal (b), and columnar (c) epithelium. If light is incident on the surface (bottom) of tissue, stratified squamous epithelium represents axially transverse spheroids, simple cuboidal represents axially symmetric spheroids, while columnar epithelium exhibits both geometries. Figure from [6].
Fig. 3
Fig. 3
In vitro culture of macrophage cells in (a) random orientation and (b) oriented (orientation depends on polarization of incident light). In (b), cell nuclei are elongated in preferred direction due to nanostructural manipulation. Figure from [3] used with permission of Biophysical Journal.
Fig. 4
Fig. 4
(Color online) Schematic of axially transverse spheroids in (a) TM orientation and (b) TE orientation and the dependence of orientation on incident light polarization. The axis of symmetry is the polar axis, while the axis rotated about the axis of the symmetry is the equatorial axis.
Fig. 5
Fig. 5
Spheroidal scattering data simulated by T-matrix theory alongside its best fit to Mie theory. Best fit was determined by least-squares (χ2) fitting. (a) Cell scattering with equal volume diameter D=6.0 μm and aspect ratio ε=0.8; best fit to spherical diameter of 5.4 μm (for this aspect ratio, the equatorial axis a=5.56 μm). (b) Cell scattering with D =6.0 μm and ε=1.2; best fit to spherical diameter of 6.3 μm (for this aspect ratio a=6.37 μm). (c) Phantom scattering with D=7.0 μm and ε=1.3; best fit to spherical diameter of 5.9 μm (for this aspect ratio, the polar axis b=5.81 μm). (d) Phantom scattering with D=7.0 μm and ε=0.82; best fit to spherical diameter of 7.9 μm (for this aspect ratio b=7.99 μm).
Fig. 6
Fig. 6
Cell scattering data were simulated with T-matrix theory in six different configurations (a)–(f), as denoted below each part, spanning three orientations (random, TE, and TM) and two linear incident light polarizations (S11 and S22). For a chosen aspect ratio, the scattering data were compared to a Mie-theory database to determine the most probable size. Each dot in the figure represents the best fit size determined by Mie theory for a given aspect ratio. The equatorial (dashed) and polar (solid) manifolds are drawn with a width of 2λ/ns.

References

    1. Bohren CF, Huffman DR. Absorption and Scattering of Light by Small Particles. Wiley; 1983. pp. 1–20.
    1. van de Hulst HC. Light Scattering by Small Particles, Structure of Matter Series. Wiley; 1957. p. 470.
    1. Chalut KJ, Chen S, Finan JD, Giacomelli MG, Guilak F, Leong KW, Wax A. Label-free, high-throughput measurements of dynamic changes in cell nuclei using angle-resolved low coherence interferometry. Biophys J. 2008;94:4948–4956. - PMC - PubMed
    1. Chalut KJ, Kresty LA, Pyhtila JW, Nines R, Baird M, Steele VE, Wax A. In situ assessment of intraepithelial neoplasia in hamster trachea epithelium using angle-resolved low-coherence interferometry. Cancer Epidemiol Biomarkers Prev. 2007;16:223–227. - PubMed
    1. Pyhtila JW, Chalut KJ, Boyer JD, Keener J, D'Amico T, Gottfried M, Gress F, Wax A. In situ detection of nuclear atypia in Barrett's esophagus by using angle-resolved low-coherence interferometry. Gastrointest Endosc. 2007;65:487–491. - PubMed

Publication types