

Can laser speckle flowmetry be made a quantitative tool?
- PMID: 18677371
- PMCID: PMC2572153
- DOI: 10.1364/josaa.25.002088
Can laser speckle flowmetry be made a quantitative tool?
Abstract
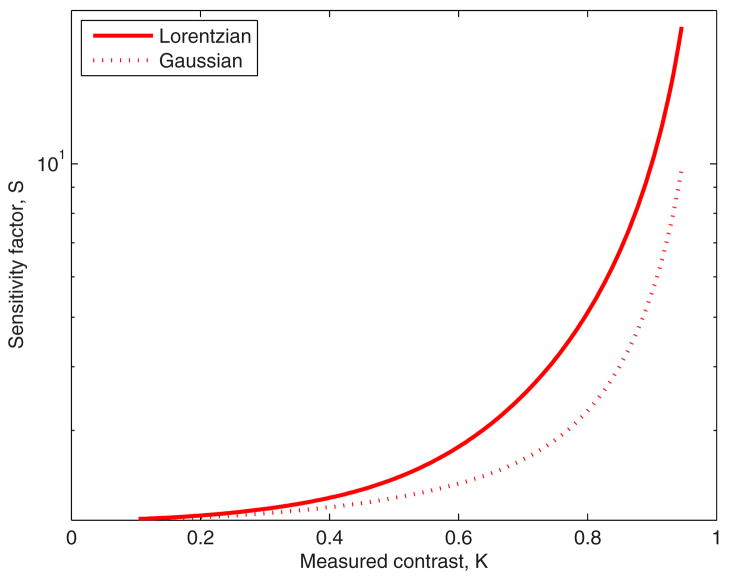
The ultimate objective of laser speckle flowmetry (and a host of specific implementations such as laser speckle contrast analysis, LASCA or LSCA; laser speckle spatial contrast analysis, LSSCA; laser speckle temporal contrast analysis, LSTCA; etc.) is to infer flow velocity from the observed speckle contrast. Despite numerous demonstrations over the past 25 years of such a qualitative relationship, no convincing quantitative relationship has been proven. One reason is a persistent mathematical error that has been propagated by a host of workers; another is a misconception about the proper autocorrelation function for ordered flow. Still another hindrance has been uncertainty in the specific relationship between decorrelation time and local flow velocity. Herein we attempt to dispel some of these errors and misconceptions with the intent of turning laser speckle flowmetry into a quantitative tool. Specifically we review the underlying theory, explore the impact of various analytic models for relating measured intensity fluctuations to scatterer motion, and address some of the practical issues associated with the measurement and subsequent data processing.
Figures


References
-
- Fercher AR, Briers JD. Flow visualization by means of single-exposure speckle photography. Opt Commun. 1981;37:326–330.
-
- Isono H, Kishi S, Kimura Y, Hagiwara N, Konishi N, Fujii H. Observation of choroidal circulation using index of erythrocytic velocity. Arch Ophthalmol (Chicago) 2003;121:225–231. - PubMed
-
- Aizu Y, Asakura T. Coherent optical techniques for diagnostics of retinal blood flow. J Biomed Opt. 1999;4:61–75. - PubMed
-
- Durduran T, Burnett MG, Yu G, Zhou C, Furuya D, Yodh AG, Detre JA, Greenburg JH. Spatiotemporal quantification of cerebral blood flow during functional activation in rat somatosensory cortex using laser-speckle flowmetry. J Cereb Blood Flow Metab. 2004;24:518–525. - PubMed
-
- Yoshimura T. Statistical properties of dynamic speckles. J Opt Soc Am A. 1986;3:1032–1054.
Publication types
MeSH terms
Grants and funding
LinkOut - more resources
Full Text Sources
Other Literature Sources
Miscellaneous
