. 2008 Sep;118(9):3109-22.
doi: 10.1172/JCI34120.

Resistance of human glioblastoma multiforme cells to growth factor inhibitors is overcome by blockade of inhibitor of apoptosis proteins

Affiliations

Resistance of human glioblastoma multiforme cells to growth factor inhibitors is overcome by blockade of inhibitor of apoptosis proteins

David S Ziegler et al. J Clin Invest. 2008 Sep.

Abstract

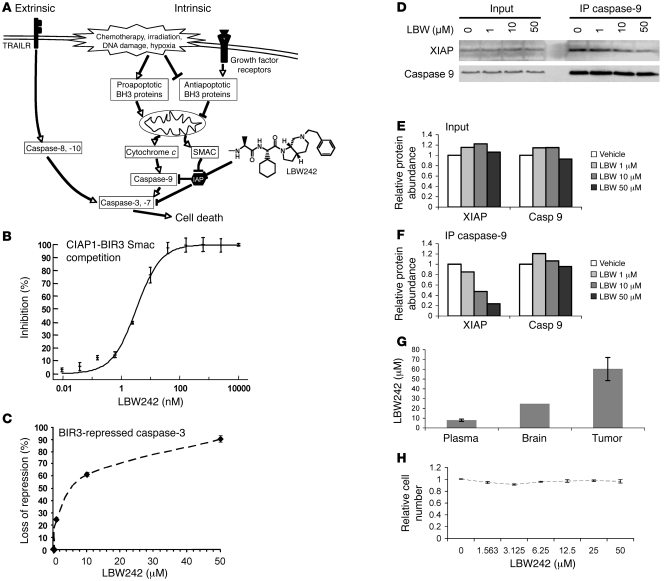
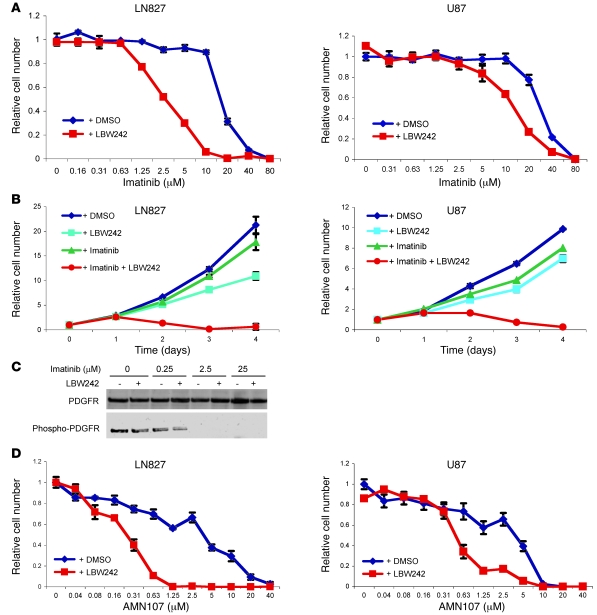
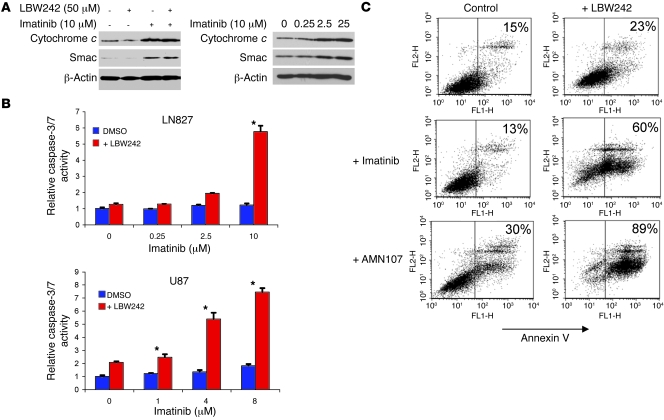
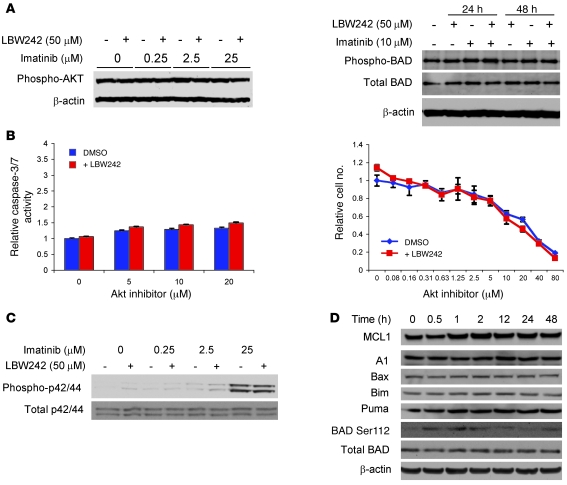
Multiple receptor tyrosine kinases (RTKs), including PDGFR, have been validated as therapeutic targets in glioblastoma multiforme (GBM), yet inhibitors of RTKs have had limited clinical success. As various antiapoptotic mechanisms render GBM cells resistant to chemo- and radiotherapy, we hypothesized that these antiapoptotic mechanisms also confer resistance to RTK inhibition. We found that in vitro inhibition of PDGFR in human GBM cells initiated the intrinsic pathway of apoptosis, as evidenced by mitochondrial outer membrane permeabilization, but downstream caspase activation was blocked by inhibitor of apoptosis proteins (IAPs). Consistent with this, inhibition of PDGFR combined with small molecule inactivation of IAPs induced apoptosis in human GBM cells in vitro and had synergistic antitumor effects in orthotopic mouse models of GBM and in primary human GBM neurospheres. These results demonstrate that concomitant inhibition of IAPs can overcome resistance to RTK inhibitors in human malignant GBM cells, and suggest that blockade of IAPs has the potential to improve treatment outcomes in patients with GBM.


Figures

Figure 1
Figure 1. Structure and function of LBW242.
(A) Schematic of the apoptotic pathway with structure and site of action of LBW242, which binds to the IAPs and prevents their neutralization of the caspases. (B) LBW242 competes with full-length Smac for occupancy of the XIAP-BIR3 surface groove, as assessed by a time-resolved fluorescence energy transfer assay. (C) LBW242 overcomes XIAP-BIR3–mediated repression of caspase-3 activity in a cell-free extract, resulting in activation of caspase-3 and cleavage of a fluorogenic substrate. (D) LN827 cells treated with the indicated concentrations of LBW242 for 4 hours reveal no change in cellular levels of XIAP or caspase-9 (input). Immunoprecipitation of caspase-9 followed by immunoblot analysis revealed dose-dependent decrease in associated XIAP (IP caspase-9). (E and F) Densitometric analysis with data expressed relative to vehicle controls. (G) LBW242 concentrations in plasma, brain, and tumor of 3 SK-OV-3 tumor–bearing nude mice after 14 days of daily parenteral dosing of LBW242 (50 mg/kg), measured 4 hours following the final dose. Data represent mean ± SEM for plasma and tumor, and the average of pooled samples for brain. (H) U87 cells were treated in triplicate with the indicated concentrations of LBW242. Relative cell numbers were assessed by 3-(4,5-dimethylthiazol-2-yl)-5-(3-carboxymethoxyphenyl)-2-(4-sulfophenyl)-2H-tetrazolium, inner salt (MTS) assay (see Methods). Data points represent the mean ± SEM.
Figure 2
Figure 2. Synergistic effects of LBW242 and imatinib.
(A) U87 and LN827 cells were treated with the indicated concentrations of imatinib in combination with LBW242 (50 μM) or DMSO control. Cell numbers were determined 72 hours later via MTS. Data are expressed as mean ± SEM of triplicates. Similar results were observed in >3 independent experiments. (B) U87 and LN827 cells were seeded in 96-well plates and treated with LBW242 (50 μM), imatinib (8 μM), LBW242 plus imatinib, or DMSO control. The number of viable cells was measured via MTS assay after 24, 48, 72, and 96 hours. The data are expressed relative to the first day of treatment and are represented as the mean ± SEM of triplicates. (C) Serum-starved LN827 cells were treated for 90 minutes with dosages of imatinib and LBW242 as indicated. Levels of PDGFR and phospho-PDGFR were measured following immunoprecipitation and immunoblotting. (D) U87 and LN827 cells were seeded in 96-well plates and treated with the PDGFR inhibitor AMN107 at the dosages indicated in combination with LBW242 (50 μM) or DMSO control. Cellular proliferation was measured via MTS assay after 72 hours of incubation. Data are represented as the mean ± SEM or triplicates.
Figure 3
Figure 3. PDGFR and IAP inhibition combine to enhance caspase activity and activate apoptosis in glioma cells.
(A) LN827 cells were treated with drugs as indicated for 48 hours, following which the cellular cytoplasm was separated from mitochondria. The cytosol was collected and subjected to immunoblotting for cytochrome c and Smac/DIABLO. (B) LN827 and U87 cells were treated with imatinib at the dosages indicated for 48 hours in combination with LBW242 (50 μM) or DMSO control. Caspase-3/7 activity is expressed relative to controls as mean ± SEM of triplicates. *P < 0.01, 2-tailed Student’s t test. (C) Apoptosis was measured as the proportion of cells staining positive for annexin V after 72 hours of incubation with LBW242 (50 μM) in combination with or without imatinib (10 μM) or AMN107 (5 μM). Cells to the left of the divider in each panel are negative for annexin V, and positive cells are to the right. The number in the upper right corners indicates the percentage of annexin V–positive cells in each treatment group. Similar results were obtained in 3 independent experiments.
Figure 4
Figure 4. Imatinib induces apoptosis independent of Akt.
(A) LN827 cells were treated with imatinib with or without LBW242, as indicated. No appreciable effects on Akt activation were apparent after 6 hours of treatment, as assessed by Ser473 phosphorylation. No effects on total or Ser112 phosphorylated BAD were apparent at 24 or 48 hours. (B) LN827 cells were treated with the Akt inhibitor triciribine at the dosages indicated and with LBW242 (50 μM) or DMSO. Caspase-3/7 activity was measured at 48 hours and total cell number at 72 hours. (C) Effects of imatinib with or without LBW242 on p42/44 activation were assessed after 6 hours. (D) Effects of imatinib with or without LBW242 on BCL2 family members were assessed at the indicated times. In all cases, no significant differences were apparent.
Figure 5
Figure 5. NOL3 is expressed in gliomas and is modulated by imatinib.
(A) Quantitative RT-PCR evaluation of NOL3 mRNA expression in LN827 cells following treatment with 10 μM imatinib. Data represent mean ± SEM of triplicates. *P < 0.01, 2-tailed Student’s t test. (B) Western blot showing NOL3 protein levels in LN827 cells following treatment with imatinib 10 μM for the indicated times. (C) Comparison of NOL3 mRNA expression levels in normal brain tissue, compared with GBM specimens. P values were calculated using unpaired t test with Welch's correction. Data values were obtained from the GSE4290 dataset (see Methods). (D) Comparison of NOL3 mRNA expression levels in grade III, grade IV, and recurrent high-grade gliomas, with P values calculated using the 1-way ANOVA test. Data values were obtained from the GSE4271 dataset (see Methods). (E) Kaplan-Meier survival curves for patients with high-grade gliomas based on NOL3 expression level. Results were separated above or below the median NOL3 level, and P values were calculated by the log-rank test. Data values were obtained from the GSE4271 dataset. (F) Western blot showing NOL3 protein levels in 293T cells following transfection with NOL3 plasmid. (G) LN827 cells were transfected with CD19 plasmid and either NOL3 plasmid or control vector. Cells were then treated with LBW242 50 μM plus imatinib 10 μM or with vehicle control for 72 hours. Cells were stained with annexin V–PE and CD19-FITC antibodies and analyzed by flow cytometry, with CD19 used as a marker of successful transfection and annexin V–PE as a marker of apoptosis. P values were calculated by 2-tailed Student’s t test. (H) LN827 cells were transfected with 50 nM NOL3 siRNA, control (CT) siRNA, or Lipofectamine 2000 only (Nil). Western blot was performed for NOL3 protein after 72 hours, with all samples on a single gel but not in contiguous wells. (I) LN827 cells were transfected with either control or NOL3 siRNA. LBW242 50 μM was added 5 hours after transfection. Apoptosis was determined by annexin V and PI staining after 72 hours of treatment. (J) LN827 cells were similarly treated with etoposide 50 μg/ml for 48 hours. P values were calculated using the 2-tailed Student’s t test.
Figure 6
Figure 6. AMN107 and LBW242 combine to inhibit the growth of intracranial LN827 orthografts and primary human glioblastoma neurospheres in vitro and in vivo.
(A) Bioluminescent images from control and treated animals at the start and end of a 15-day treatment with the indicated doses of LBW242 and/or AMN107. (B) Tumor burden was assessed by serial bioluminescence imaging and expressed relative to the start of treatment. Data are mean values ± SEM, n = 6 animals per group. (C) Primary human glioma neurospheres were derived from 2 different patients (BT69, white bars; BT79, black bars) and were treated with imatinib and/or LBW242. (D) Total neurosphere numbers were counted and photographed 10 days after plating, with data expressed as relative mean ± SD of triplicates. (E) Tumor neurospheres treated for 72 hours with imatinib, AMN107 (AMN), and/or LBW242 (LBW) were lysed and activated caspase-3 was assessed by immunoblot. (F) Kaplan-Meier survival curves for mice implanted with primary human glioma orthografts. Mice were treated for 12 consecutive days with vehicle, AMN107, LBW242, or a combination of AMN107 and LBW242, with treatments beginning 12 days after implant. *P = 0.01, combination versus all other groups, for experimental day 60 and all time points thereafter.

References

    1. DeAngelis L.M. Brain tumors. N. Engl. J. Med. 2001;344:114–123. doi: 10.1056/NEJM200101113440207. - DOI - PubMed
    1. Kitange G.J., Templeton K.L., Jenkins R.B. Recent advances in the molecular genetics of primary gliomas. Curr. Opin. Oncol. 2003;15:197–203. doi: 10.1097/00001622-200305000-00003. - DOI - PubMed
    1. Broniscer A., Gajjar A. Supratentorial high-grade astrocytoma and diffuse brainstem glioma: two challenges for the pediatric oncologist. Oncologist. 2004;9:197–206. doi: 10.1634/theoncologist.9-2-197. - DOI - PubMed
    1. Mellinghoff I.K., et al. Molecular determinants of the response of glioblastomas to EGFR kinase inhibitors. N. Engl. J. Med. 2005;353:2012–2024. doi: 10.1056/NEJMoa051918. - DOI - PubMed
    1. Gammeltoft S., Ballotti R., Kowalski A., Westermark B., Van Obberghen E. Expression of two types of receptor for insulin-like growth factors in human malignant glioma. Cancer Res. 1988;48:1233–1237. - PubMed

Publication types

MeSH terms