

FTIR Microspectroscopy Coupled with Two-Class Discrimination Segregates Markers Responsible for Inter- and Intra-Category Variance in Exfoliative Cervical Cytology
- PMID: 18677422
- PMCID: PMC2493409
- DOI: 10.4137/bmi.s592
FTIR Microspectroscopy Coupled with Two-Class Discrimination Segregates Markers Responsible for Inter- and Intra-Category Variance in Exfoliative Cervical Cytology
Abstract
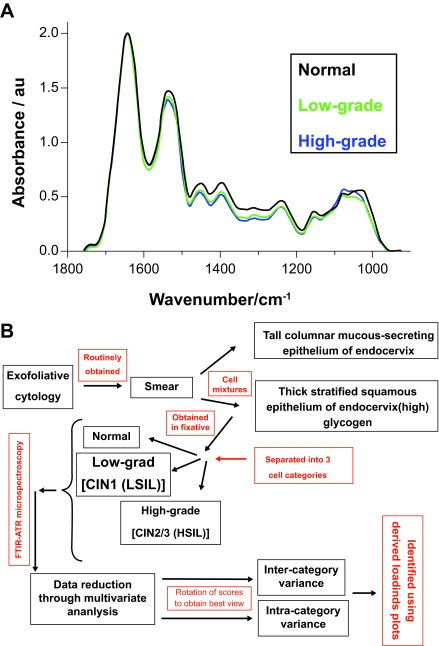
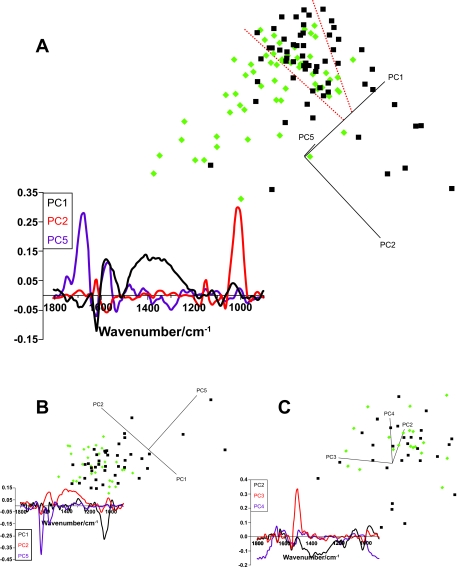
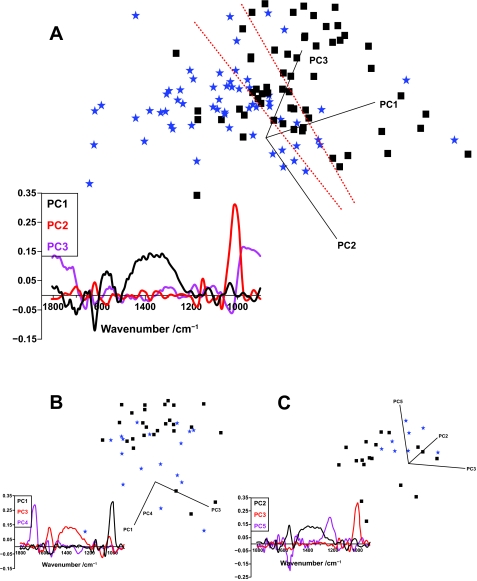
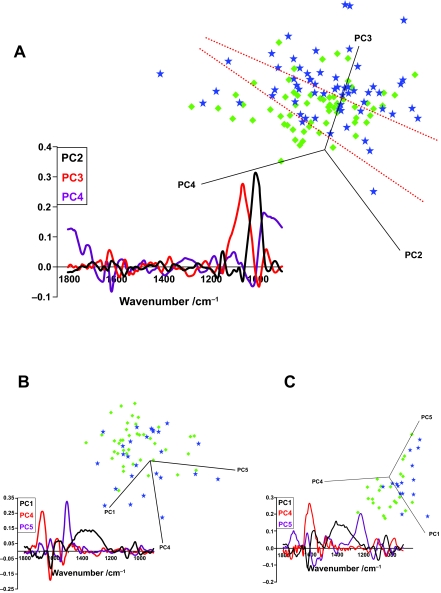
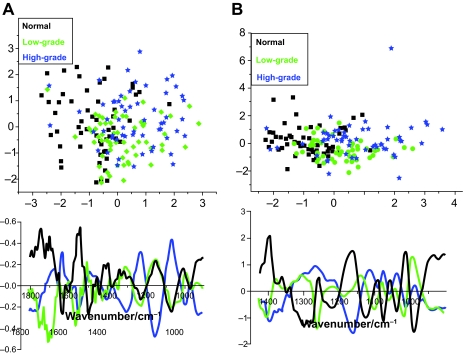
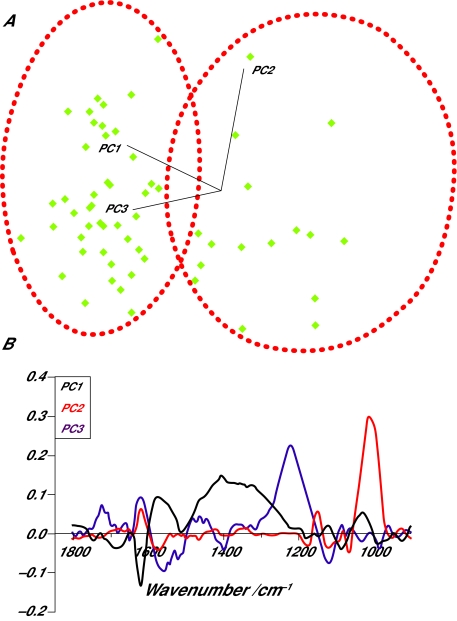
Infrared (IR) absorbance of cellular biomolecules generates a vibrational spectrum, which can be exploited as a "biochemical fingerprint" of a particular cell type. Biomolecules absorb in the mid-IR (2-20 mum) and Fourier-transform infrared (FTIR) microspectroscopy applied to discriminate different cell types (exfoliative cervical cytology collected into buffered fixative solution) was evaluated. This consisted of cervical cytology free of atypia (i.e. normal; n = 60), specimens categorised as containing low-grade changes (i.e. CIN1 or LSIL; n = 60) and a further cohort designated as high-grade (CIN2/3 or HSIL; n = 60). IR spectral analysis was coupled with principal component analysis (PCA), with or without subsequent linear discriminant analysis (LDA), to determine if normal versus low-grade versus high-grade exfoliative cytology could be segregated. With increasing severity of atypia, decreases in absorbance intensity were observable throughout the 1,500 cm(-1) to 1,100 cm(-1) spectral region; this included proteins (1,460 cm(-1)), glycoproteins (1,380 cm(-1)), amide III (1,260 cm(-1)), asymmetric (nu(as)) PO(2) (-) (1,225 cm(-1)) and carbohydrates (1,155 cm(-1)). In contrast, symmetric (nu(s)) PO(2) (-) (1,080 cm(-1)) appeared to have an elevated intensity in high-grade cytology. Inter-category variance was associated with protein and DNA conformational changes whereas glycogen status strongly influenced intra-category. Multivariate data reduction of IR spectra using PCA with LDA maximises inter-category variance whilst reducing the influence of intra-class variation towards an objective approach to class cervical cytology based on a biochemical profile.
Figures
References
-
- Andrus PG, Strickland RD. Cancer grading by Fourier transform infrared spectroscopy. Biospectroscopy. 1998;4:37–46. - PubMed
-
- Argov S, Ramesh J, Salman A, Sinelikov I, Goldstein J, Guterman H, Mordechai S. Diagnostic potential of Fourier-transform infrared microspectroscopy and advanced computational methods in colon cancer patients. . J. Biomed. Opt. 2002;7:248–54. - PubMed
-
- Argov S, Sahu RK, Bernshtain E, Salman A, Shohat G, Zelig U, Mordechai S. Inflammatory bowel diseases as an intermediate stage between normal and cancer: a FTIR-microspectroscopy approach. Biopolymers. 2004;75:384–92. - PubMed
-
- Barber JL, Walsh MJ, Hewitt R, Jones KC, Martin FL. Low-dose treatment with polybrominated diphenyl ethers (PBDEs) induce altered characteristics in MCF-7 cells. Mutagenesis. 2006;21:351–60. - PubMed
Grants and funding
LinkOut - more resources
Full Text Sources
Research Materials
