. 2008 Nov 1;17(21):3263-70.
doi: 10.1093/hmg/ddn222. Epub 2008 Aug 4.

Dynamic variation in allele-specific gene expression of Paraoxonase-1 in murine and human tissues

Affiliations

Dynamic variation in allele-specific gene expression of Paraoxonase-1 in murine and human tissues

Layla Parker-Katiraee et al. Hum Mol Genet. .

Abstract

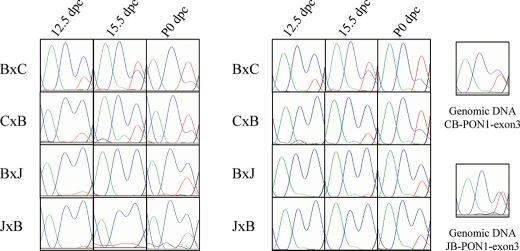
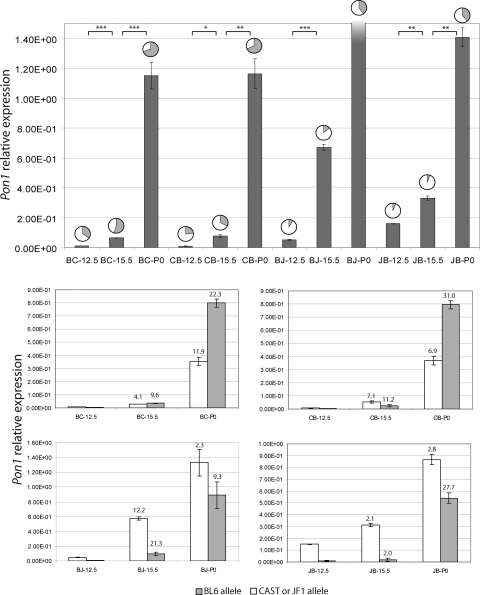
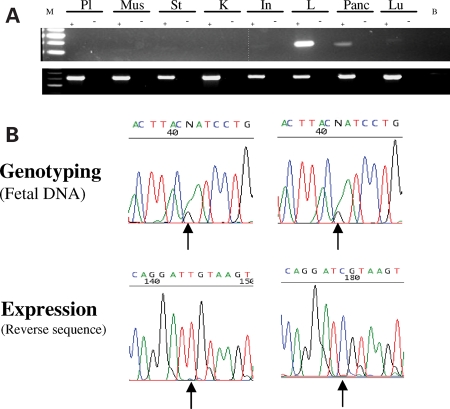
Differential allelic expression has been shown to be common in mice, humans and maize, and variability in the expression of polymorphic alleles has been associated with human disease. Here, we describe the differential expression pattern of Paraoxonase-1, a gene involved in lipid metabolism and implicated in the formation of atherosclerotic lesions. We measured the expression of the murine Paraoxonase-1 gene (Pon1) in livers at different stages of embryonic development using F1 hybrid crosses and quantified the transcriptional level of both parental alleles. Using human foetal tissues, we analysed the expression of the human orthologue (PON1) and found monoallelic or preferential allelic expression in 6/7 and 4/4 samples from liver and pancreas, respectively. We observed that Pon1 does not show a parent-of-origin preference in its allelic expression, but has dramatic variations in allele-specific expression occurring throughout development. This study has important repercussions in the analysis of haplotypes at disease loci, since it implies that the expression of polymorphic alleles can be unequal and dynamic.


Figures

Figure 1.
Figure 1.
Overview of the murine Pon1 locus. The 1 Mb region contains several imprinted genes (white boxes), as well as genes showing preferential or biallelic expression (black boxes). Transcriptional direction of each gene is shown by arrows. The intron–exon structure of Pon1 is depicted below, as well as its non-coding or putative non-coding region (grey segments). Primers used for amplifying cDNA fragments and primers used for amplification of genomic DNA in SNP identification are indicated by fragments and a black bar, respectively.
Figure 2.
Figure 2.
Expression pattern of Pon1. Electropherograms from sequencing of two sets of liver cDNA samples from hybrid crosses at different developmental stages are shown. Results from amplification of genomic DNA are indicated on the right. The blue and red peaks indicate C and T, respectively, where T is the allele inherited from BL6 in Pon1. Letters B, C and J refer to species BL6, CAST and JF1, respectively, with the first letter of each cross representing the mother. The results show reproducibility in the two sample sets and indicate a dynamic pattern of expression throughout development.
Figure 3.
Figure 3.
Real-time quantitative PCR analysis of Pon1. Transcript abundance of hepatic Pon1 at various stages of embryonic development in F1 hybrid mice was quantified by SYBR Green detection method in triplicate. Values in the uppermost section represent total average Pon1 measurements normalized by β-2-microglobulin expression in each sample. Frequencies of CAST or JF1 and BL6 alleles measured by pyrosequencing are represented by pie charts, where the white portions represent the CAST or JF1 allele and the grey portions represent the BL6 allele. The shading in BJ-P0 expression indicates that it goes beyond the upper limit of the graph. The total expression at this developmental time point was found to be 22.2 ± 3.00 × 10⁻¹. The four charts in the lower section represent the relative contribution of each allele towards the total expression of Pon1, where the cross and developmental time point is indicated at the bottom of each bar. Fold increase in the expression of each allele from the previous time point is also indicated at the top of the bar. Error bars were calculated using the standard deviation of both pyrosequencing and quantitative PCR results. The results indicate a disproportionate increase in the expression of each allele. JB, CB, BC and BJ refer to JxB, CxB, BxC and BxJ F1 hybrids, respectively.
Figure 4.
Figure 4.
Human PON1 expression. (A) PON1 tissue expression. RT-PCR was performed on placenta (Pl), muscle (Mus), stomach (St), kidney (K), intestine (In), liver (L), pancreas (Panc) and lung (Lu). B, blank; M, marker. Upper panel shows PON1 expression, lower panel shows GAPDH control expression. (B) Monoallelic expression of human PON1 in the liver and pancreas. Biallelic sequencing results of a human PON1 polymorphism from foetal samples are shown in the top panels. cDNA sequencing of PON1 in the liver (left panel) and pancreas (right panel) showing monoallelic expression of the polymorphism (bottom panels).

References

    1. Lo H.S., Wang Z., Hu Y., Yang H.H., Gere S., Buetow K.H., Lee M.P. Allelic variation in gene expression is common in the human genome. Genome Res. 2003;13:1855–1862. - PMC - PubMed
    1. Bray N.J., Buckland P.R., Owen M.J., O’Donovan M.C. Cis-acting variation in the expression of a high proportion of genes in human brain. Hum. Genet. 2003;113:149–153. - PubMed
    1. Cowles C.R., Hirchhorn J.N., Altshuler D., Lander E. Detection of regulatory variation in mouse genes. Nat. Genet. 2002;32:432–437. - PubMed
    1. Guo M., Rupe M.A., Zinselmeier C., Habben J., Bowen B.A., Smith O.S. Allelic variation of gene expression in maize hybrids. Plant Cell. 2004;16:1707–1716. - PMC - PubMed
    1. Yan H., Dobbie Z., Gruber S.B., Markowitz S., Romans K., Giardiello F.M., Kinzler K.W., Vogelstein B. Small changes in expresion affect predisposition to tumorigenesis. Nat. Genet. 2001;30:25–26. - PubMed

Publication types