. 2008 Oct;76(10):4726-36.
doi: 10.1128/IAI.00319-08. Epub 2008 Aug 4.

Antibiotic-induced perturbations of the intestinal microbiota alter host susceptibility to enteric infection

Affiliations

Antibiotic-induced perturbations of the intestinal microbiota alter host susceptibility to enteric infection

Inna Sekirov et al. Infect Immun. 2008 Oct.

Abstract

Intestinal microbiota comprises microbial communities that reside in the gastrointestinal tract and are critical to normal host physiology. Understanding the microbiota's role in host response to invading pathogens will further advance our knowledge of host-microbe interactions. Salmonella enterica serovar Typhimurium was used as a model enteric pathogen to investigate the effect of intestinal microbiota perturbation on host susceptibility to infection. Antibiotics were used to perturb the intestinal microbiota. C57BL/6 mice were treated with clinically relevant doses of streptomycin and vancomycin in drinking water for 2 days, followed by oral infection with Salmonella enterica serovar Typhimurium. Alterations in microbiota composition and numbers were evaluated by fluorescent in situ hybridization, differential plating, and Sybr green staining. Antibiotics had a dose-dependent effect on intestinal microbiota composition. The chosen antibiotic regimen did not significantly alter the total numbers of intestinal bacteria but altered the microbiota composition. Greater preinfection perturbations in the microbiota resulted in increased mouse susceptibility to Salmonella serovar Typhimurium intestinal colonization, greater postinfection alterations in the microbiota, and more severe intestinal pathology. These results suggest that antibiotic treatment alters the balance of the microbial community, which predisposes the host to Salmonella serovar Typhimurium infection, demonstrating the importance of a healthy microbiota in host response to enteric pathogens.


Figures

FIG. 1.
FIG. 1.
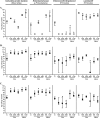
FISH assessment of microbiota prior to and following Salmonella serovar Typhimurium infection in antibiotic-treated and untreated mice. Experiments were repeated two to three times with three to six mice per group. Values are percentages of all eubacteria (with standard deviations in parentheses); the average of all replicas is shown. Proportions of CFB and Gammaproteobacteria were determined as described in Materials and Methods. Proportions of Firmicutes and other bacteria were estimated as 100 − percentage of CFB − percentage of Gammaproteobacteria. P values were calculated using one-way ANOVA with Bonferroni's posttest, with a 95% confidence interval. (A) Microbiota composition in colons of uninfected mice with and without antibiotic treatment. Mice were treated with the specified antibiotics in drinking water for 2 days. Doses are in mg/liter. (B) Microbiota composition in colons of Salmonella serovar Typhimurium-infected mice with and without antibiotic pretreatment. Mice were treated with the specified antibiotics in drinking water for 2 days. Doses are in mg/liter. After antibiotic withdrawal, mice were infected with 2.7 × 10⁸ CFU of Salmonella serovar Typhimurium for 3 days. Groups marked with an asterisk have a proportion of Gammaproteobacteria significantly different from that of the control (C) group (P < 0.05). (C) Microbiota composition in ceca of Salmonella serovar Typhimurium-infected mice with and without antibiotic pretreatment. Mice were treated with the specified antibiotics in drinking water for 2 days. Doses are in mg/liter. After antibiotic withdrawal, mice were infected with 2.7 × 10⁸ CFU of Salmonella serovar Typhimurium for 3 days. Groups marked with an asterisk have a proportion of Gammaproteobacteria significantly different from that of the C group (P < 0.05).
FIG. 2.
FIG. 2.
Differential plating assessment of microbiota prior to and following Salmonella serovar Typhimurium infection in antibiotic-treated and untreated mice. Experiments were repeated two to three times with three to six mice per group. Median and interquartile ranges and the average of all replicas are shown. The specified bacterial groups were grown as described in Materials and Methods. P values were calculated using one-way ANOVA with Bonferroni's posttest, with a 95% confidence interval. C, control; Sm, streptomycin; Vanc, vancomycin. (A) Microbiota composition in colons of uninfected mice with and without antibiotic treatment. Mice were treated with the specified antibiotics in drinking water for 2 days. Doses are in mg/liter. Groups marked with an asterisk are significantly different from the C group (P < 0.05). (B) Microbiota composition in colons of Salmonella serovar Typhimurium-infected mice with and without antibiotic pretreatment. Mice were treated with the specified antibiotics in drinking water for 2 days. Doses are in mg/liter. After antibiotic withdrawal, mice were infected with 2.7 × 10⁸ CFU of Salmonella serovar Typhimurium for 3 days. Groups marked with an asterisk are significantly different from the C group (P < 0.05). (C) Microbiota composition in ceca of Salmonella serovar Typhimurium-infected mice with and without antibiotic pretreatment. Mice were treated with the specified antibiotics in drinking water for 2 days. Doses are in mg/liter. After antibiotic withdrawal, mice were infected with 2.7 × 10⁸ CFU of Salmonella serovar Typhimurium for 3 days. Groups marked with an asterisk are significantly different from the C group (P < 0.05).
FIG. 3.
FIG. 3.
Sybr green assessment of microbiota prior to and following Salmonella serovar Typhimurium infection in antibiotic-treated and untreated mice. Experiments were repeated two to three times with three to six mice per group. The total numbers of bacteria were determined by Sybr green DNA staining. The results of a representative experiment are shown. Error bars indicate standard deviations. P values were calculated using one-way ANOVA with Bonferroni's posttest, with a 95% confidence interval. C, control; Sm, streptomycin; Vanc, vancomycin. (A) Total numbers of microbiota in colons of uninfected mice with and without antibiotic treatment. Mice were treated with the specified antibiotics in drinking water for 2 days. Doses are in mg/liter. Values above bars indicate the percentage of bacteria compared to that for the control group. All antibiotic-treated groups did not differ significantly from the control group. (B) Total numbers of microbiota in colons of Salmonella serovar Typhimurium-infected and uninfected mice with and without antibiotic pretreatment. Mice were treated with the specified antibiotics in drinking water for 2 days. Doses are in mg/liter. After antibiotic withdrawal, mice in the Salmonella serovar Typhimurium group were infected with 2.7 × 10⁸ CFU of Salmonella serovar Typhimurium for 3 days (black bars); mice in the uninfected group received no further treatment (white bars). Groups marked with an asterisk are significantly different from the respective infected or uninfected C group (P < 0.05). (C) Total numbers of microbiota in ceca of Salmonella serovar Typhimurium-infected and uninfected mice with and without antibiotic pretreatment. Mice were treated with the specified antibiotics in drinking water for 2 days. Doses are in mg/liter. After antibiotic withdrawal, mice in the Salmonella serovar Typhimurium group were infected with 2.7 × 10⁸ CFU of Salmonella serovar Typhimurium for 3 days (black bars); mice in the uninfected group received no further treatment (white bars). Groups marked with an asterisk are significantly different from the respective infected or uninfected C group (P < 0.05).
FIG. 4.
FIG. 4.
Salmonella serovar Typhimurium colonization of the intestinal tract of antibiotic-treated and untreated mice. Mice were treated with the specified antibiotics in drinking water for 2 days. Doses are in mg/liter. After antibiotic withdrawal, mice in the Salmonella serovar Typhimurium group were infected with 2.7 × 10⁸ CFU of Salmonella serovar Typhimurium for 3 days; mice in the uninfected group received no further treatment. Experiments were repeated two to three times with three to six mice per group. Salmonella serovar Typhimurium colonization was enumerated by plating serial dilutions of organ homogenates on LB or xylose-lysine-deoxycholate plates with 100 μg/ml streptomycin. The results of a representative experiment are shown. P values were calculated using one-way ANOVA with Bonferroni's posttest, with a 95% confidence interval. C, control; Sm, streptomycin; Vanc, vancomycin. (A) Salmonella serovar Typhimurium colonization in colons of infected and uninfected mice with and without antibiotic pretreatment. Groups marked with an asterisk are significantly different from the infected C group (P < 0.05). The dashed line indicates the limit of detection. (B) Salmonella serovar Typhimurium colonization in ceca of infected and uninfected mice with and without antibiotic pretreatment. Groups marked with an asterisk are significantly different from the infected C group (P < 0.05). The dashed line indicates the limit of detection.
FIG. 5.
FIG. 5.
Salmonella serovar Typhimurium-induced intestinal pathology. Mice were treated with the specified antibiotics in drinking water for 2 days. Doses are in mg/liter. Following antibiotic withdrawal, mice were infected with 2.7 × 10⁸ CFU of Salmonella serovar Typhimurium for 3 days. Experiments were repeated three times with six mice per group. The results of a representative experiment are shown. P values were calculated using Kruskal-Wallis with Dunn's posttest, with a 95% confidence interval. C, control; Sm, streptomycin; Vanc, vancomycin. (A) Tissues were harvested, fixed in formalin, and stained with H&E. Antibiotic-treated Salmonella serovar Typhimurium-infected sections show escalating pathology, indicated by rising levels of inflammatory infiltrate starting from the submucosa and spreading to the lumen, as well as increasing epithelial disorganization, indicated by mucinous plugs in crypts, mounting epithelial regenerative changes, desquamation, and the presence of dead epithelial cells in the lumen. Arrowheads indicate the lumen. (B) Quantification of indicators of pathology. Groups marked with an asterisk are significantly different from the respective C group (P < 0.05).
FIG. 6.
FIG. 6.
Inflammatory mediators in the ceca of infected and uninfected mice. Mice were treated with the specified antibiotics in drinking water for 2 days. Doses are in mg/liter. Following antibiotic withdrawal, mice were infected with 2.7 × 10⁸ CFU of Salmonella serovar Typhimurium for 3 days. Experiments were repeated three times with six mice per group. Error bars indicate standard deviations. The results of a representative experiment are shown. Levels of inflammatory mediators were determined by ELISAs with infected (black bars) and uninfected (white bars) animals. Levels are normalized to the total protein content in samples. P values were calculated using one-way ANOVA with Bonferroni's posttest, with a 95% confidence interval. Groups marked with an asterisk are significantly different from the respective C group (P < 0.05). C, control; Sm, streptomycin; Vanc, vancomycin; KC, keratinocyte chemoattractant; IL-6, interleukin-6.

References

    1. Akira, S., T. Hirano, T. Taga, and T. Kishimoto. 1990. Biology of multifunctional cytokines: IL 6 and related molecules (IL 1 and TNF). FASEB J. 42860-2867. - PubMed
    1. Amann, R. I., B. J. Binder, R. J. Olson, S. W. Chisholm, R. Devereux, and D. A. Stahl. 1990. Combination of 16S rRNA-targeted oligonucleotide probes with flow cytometry for analyzing mixed microbial populations. Appl. Environ. Microbiol. 561919-1925. - PMC - PubMed
    1. Banks, C., A. Bateman, R. Payne, P. Johnson, and N. Sheron. 2003. Chemokine expression in IBD. Mucosal chemokine expression is unselectively increased in both ulcerative colitis and Crohn's disease. J. Pathol. 19928-35. - PubMed
    1. Barman, M., D. Unold, K. Shifley, E. Amir, K. Hung, N. Bos, and N. Salzman. 2008. Enteric salmonellosis disrupts the microbial ecology of the murine gastrointestinal tract. Infect. Immun. 76907-915. - PMC - PubMed
    1. Barthel, M., S. Hapfelmeier, L. Quintanilla-Martinez, M. Kremer, M. Rohde, M. Hogardt, K. Pfeffer, H. Russmann, and W. D. Hardt. 2003. Pretreatment of mice with streptomycin provides a Salmonella enterica serovar Typhimurium colitis model that allows analysis of both pathogen and host. Infect. Immun. 712839-2858. - PMC - PubMed

Publication types

MeSH terms