. 2008 Oct 17;283(42):28020-8.
doi: 10.1074/jbc.M804399200. Epub 2008 Aug 4.

Proteinase-activated receptor 2 stimulates Na,K-ATPase and sodium reabsorption in native kidney epithelium

Affiliations

Proteinase-activated receptor 2 stimulates Na,K-ATPase and sodium reabsorption in native kidney epithelium

Luciana Morla et al. J Biol Chem. .

Abstract

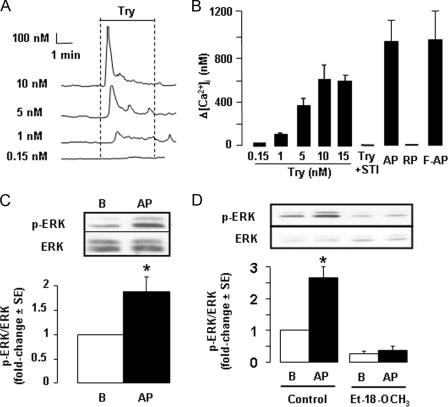
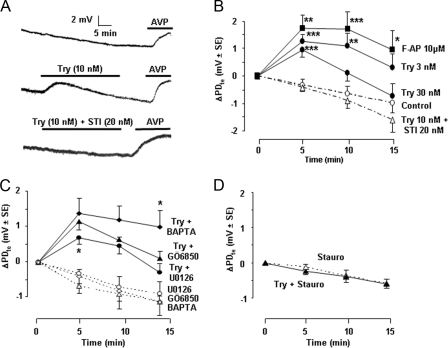
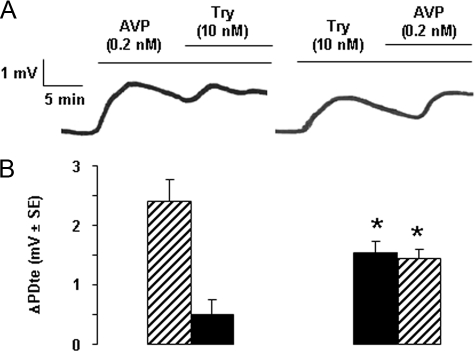
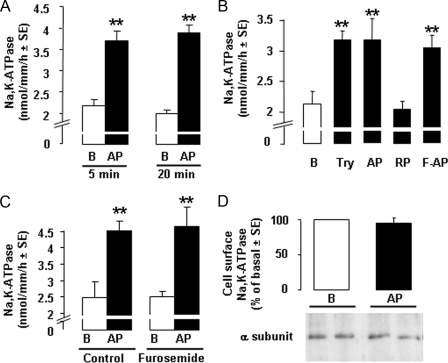
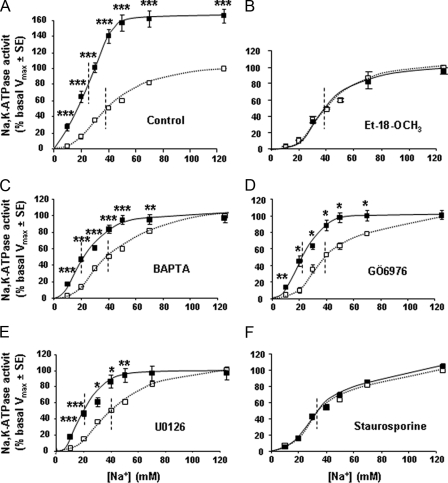
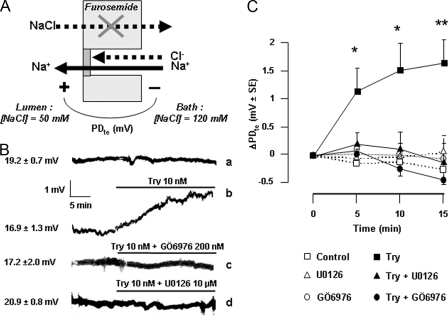
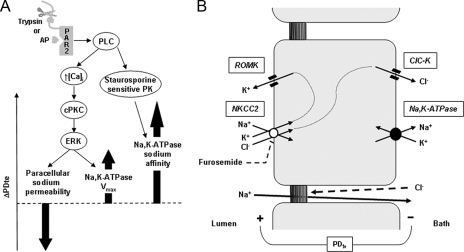
Proteinase-activated receptors 2 (PAR2) are expressed in kidney, but their function is mostly unknown. Since PAR2 control ion transport in several epithelia, we searched for an effect on sodium transport in the cortical thick ascending limb of Henle's loop, a nephron segment that avidly reabsorbs NaCl, and for its signaling. Activation of PAR2, by either trypsin or a specific agonist peptide, increased the maximal activity of Na,K-ATPase, its apparent affinity for sodium, the sodium permeability of the paracellular pathway, and the lumen-positive transepithelial voltage, featuring increased NaCl reabsorption. PAR2 activation induced calcium signaling and phosphorylation of ERK1,2. PAR2-induced stimulation of Na,K-ATPase Vmax was fully prevented by inhibition of phospholipase C, of changes in intracellular concentration of calcium, of classical protein kinases C, and of ERK1,2 phosphorylation. PAR2-induced increase in paracellular sodium permeability was mediated by the same signaling cascade. In contrast, increase in the apparent affinity of Na,K-ATPase for sodium, although dependent on phospholipase C, was independent of calcium signaling, was insensitive to inhibitors of classical protein kinases C and of ERK1,2 phosphorylation, but was fully prevented by the nonspecific protein kinase inhibitor staurosporine, as was the increase in transepithelial voltage. In conclusion, PAR2 increases sodium reabsorption in rat thick ascending limb of Henle's loop along both the transcellular and the paracellular pathway. PAR2 effects are mediated in part by a phospholipase C/protein kinase C/ERK1,2 cascade, which increases Na,K-ATPase maximal activity and the paracellular sodium permeability, and by a different phospholipase C-dependent, staurosporine-sensitive cascade that controls the sodium affinity of Na,K-ATPase.


Figures

FIGURE 1.
FIGURE 1.
PAR2 signaling in rat cTAL. A, representative traces showing changes in [Ca2+]i (Δ[Ca2+]i) in cTAL, determined by fura 2-AM fluorescence, in response to basolateral addition of different concentrations of trypsin (Try). B, comparative effects on [Ca2+]i of different concentrations of Try, 40 μm PAR2 AP, 40 μm inactive RP, 10 μm F-AP, or 20 nm soybean trypsin inhibitor and 10 nm trypsin (Try +STI). Data are means ± S.E. from 4–6 experiments. C, representative immunoblot and mean increase in the phosphoERK (p-ERK)/ERK ratio on cTAL incubated for 10 min at 37 °C under basal conditions (B) or in the presence of 40 μm PAR2 AP. Values are means ± S.E. from 8 experiments. *, p < 0.001 as compared with basal condition by Student's t test. D, same as in C in cTALs preincubated 45 min at 30 °C in the absence (control) or presence of 150 μm PLC inhibitor Et-18-OCH3. Values are means ± S.E. from 4 experiments. *, p < 0.001 as compared with basal by Student's t test.
FIGURE 2.
FIGURE 2.
Activation of PAR2 increases transepithelial voltage in rat cTAL. A, representative traces showing the spontaneous variations of PDte as a function of time (top trace) and the effect of Try (10 nm) addition to the bath in the absence (middle trace) or presence of soybean trypsin inhibitor (STI, 20 nm, bottom trace). The viability of each cTAL at the end of the experimental period was attested by the hyperpolarizing effect of the addition of 0.2 nm AVP to the bath. B, mean variation of PDte (ΔPDte) calculated 5, 10, and 15 min after the addition of Try or F-AP or in time control tubules. Values are means ± S.E. from 4–6 cTALs. Statistically significant differences between treated and time control cTALs: *, p < 0.025; **, p < 0.01; ***, p < 0.005. C, ΔPDte, calculated as above, after the addition of trypsin (10 nm, full lines) or in time controls (stippled lines) in cTALs pretreated with BAPTA (10–20 μm, 1 h at room temperature before mounting in microperfusion chamber), GÖ6850 (100 nm, for at least 35 min during PDte equilibration period), or U0126 (10 μm, for at least 35 min during the PDte equilibration period). Values are means ± S.E. from 4–6 tubules. Statistically significant differences versus trypsin alone: *, p < 0.025. D, same as in C in cTALs pretreated with staurosporine (Stauro, 15 nm, for at least 35 min during PDte equilibration period).
FIGURE 3.
FIGURE 3.
Comparative effects of activation of PAR2 and vasopressin V2 receptor on transepithelial voltage in rat cTAL. A, representative traces showing the effect on PDte of the successive addition of vasopressin (AVP, 200 pm) followed by Try (10 nm)(left trace) or trypsin followed by AVP (right trace). B, mean variation of PDte, calculated between the PDte values at the peak response and at the time of trypsin (dark columns) or AVP (hatched columns) addition. Left panel, the addition of AVP followed by trypsin; right panel, the addition of trypsin followed by AVP. Values are means ± S.E. from 5–6 cTALs. *, p < 0.01 between the two experimental series.
FIGURE 4.
FIGURE 4.
Activation of PAR2 stimulates Na,K-ATPase Vmax in the rat cTAL. A, Na,K-ATPase Vmax in cTAL incubated under basal conditions (B, open columns) or with 40 μm PAR2 AP (dark columns) for 5 or 20 min. Values are means ± S.E. from 4 (20 min) and 13 (5 min) animals. **, p < 0.001 as compared with basal. B, representative experiment showing Na,K-ATPase Vmax in cTAL incubated for 5 min at 37 °C in basal condition B or in the presence of 10 nm Try, 40 μm PAR2 AP, 40 μm inactive RP, or 10 μm F-AP. **, p < 0.001 as compared with basal. C, Na,K-ATPase activity in cTALs incubated for 5 min at 37 °C with or without 40 μm AP (B and AP, respectively) in the absence (Control) or presence of 100 μm furosemide. Values are means ± S.E. from 3 experiments. **, p < 0.001 as compared with basal. D, representative immunoblot and mean change in plasma membrane expression of Na,K-ATPase α subunit in cTAL incubated for 10 min at 37 °C under basal conditions (B) or in the presence of 40 μm PAR2 AP. Membrane Na,K-ATPase was quantified by Western blotting after biotin labeling and streptavidin precipitation. Values are means ± S.E. from 4 experiments.
FIGURE 5.
FIGURE 5.
Activation of PAR2 increases Na,K-ATPase apparent affinity for sodium in the rat cTAL. A–F, sodium dependence of Na,K-ATPase activity in cTALs preincubated for 45 min at 30 °C with either diluent (A, control) or 150 μm Et-18-OCH3 (B), 10 μm BAPTA (C), 200 nm GÖ6976 (D), 10 μm U0126 (E), or 15 nm staurosporine (F) before being incubated for 10 min at 37 °C with (solid line) or without 40 μm AP (dotted line). In each experiment, Na,K-ATPase activities at different Na+ concentrations were calculated as the percentage of the activity determined in the presence of 125 mm Na+ (Vmax) under basal condition (absence of AP). Values are means ± S.E. from 3–5 experiments. *, p < 0.025; **, p < 0.005, ***, p < 0.001 as compared with basal conditions.
FIGURE 6.
FIGURE 6.
Activation of PAR2 increases the paracellular sodium permeability. A, cTALs were microperfused in vitro in the presence of 100 μm furosemide (to fully inhibit transcellular NaCl transport) and of a NaCl concentration gradient between the bath and the luminal fluid (NaCl bath, 120 mm; NaCl perfusate, 50 mm). Under these conditions, the PDte is generated by the conductive diffusion of Na+ and/or Cl ions from the bath to the lumen through the paracellular pathway. B, the positivity of the mean PDte is accounted for by the much higher permeability of the paracellular pathway to sodium than to chloride. Trace a shows that conversely to the PDte generated by transcellular transport (Fig. 2), this sodium diffusion-generated PDte is stable as a function of time. The addition of Try (10 nm) to the bath increases the PDte (trace b), and the effect of trypsin is abolished in the presence of 200 nm GÖ6976 (trace c) or 10 μm U0126 (trace d). C, mean ΔPDte values in cTAL preincubated or not with 200 nm GÖ6976 or 10 μm U0126 and treated (solid lines) or not (dotted lines) with 10 nm Try. Values are means ± S.E. from 4–7 cTALs. *, p < 0.01; **, p < 0.005 as compared with controls.
FIGURE 7.
FIGURE 7.
Regulation of sodium transport by PAR2 in the rat cTAL. A, activation of basolateral PAR2, either by cleavage of its N-terminal domain by trypsin or by a synthetic peptide mimicking the ligand domain, is coupled to the activation of PLC. In turn, PLC triggers calcium signaling (↑ [Ca2+]i), which activates cPKc and induces the phosphorylation of ERK. Activation of ERK is responsible both for increased permeability of the tight junction to sodium and for enhanced Vmax of Na,K-ATPase. Because inhibition of this pathway has no significant effect on the transepithelial voltage (PDte), it is suggested that the opposite effects on PDte of increased Vmax of Na,K-ATPase and increased permeability to sodium of the paracellular pathway (thick arrows) are quantitatively similar. Activation of PLC also stimulates an unidentified staurosporine-sensitive protein kinase, which mediates an increase in the apparent affinity of Na,K-ATPase for sodium. Because inhibition of this pathway also abolishes PAR2-induced increase in PDte, the increased sodium affinity of Na,K-ATPase is likely a major actor of the change in PDte and to increased sodium reabsorption. B, basolateral Na,K-ATPase generates a sodium gradient allowing apical entry of sodium, potassium, and chloride via the furosemide-sensitive cotransporter NKCC2. Diffusive exit of potassium by apical ROMK and of chloride by basolateral ClC-K generates a transepithelial voltage (PDte) that drives paracellular reabsorption of sodium. Because the tight junctions are almost impermeable to chloride, there is no back diffusion of chloride toward the lumen.

Similar articles

Cited by

References

    1. Ossovskaya, V. S., and Bunnett, N. W. (2004) Physiol. Rev. 84 579–621 - PubMed
    1. Fyfe, M., Bergstrom, M., Aspengren, S., and Peterson, A. (2005) Cytokine 31 358–367 - PubMed
    1. Kawao, N., Nagataki, M., Nagasawa, K., Kubo, S., Cushing, K., Wada, T., Sekiguchi, F., Ichida, S., Hollenberg, M. D., MacNaughton, W. K., Nishikawa, H., and Kawabata, A. (2005) J. Pharmacol. Exp. Ther. 315 576–589 - PubMed
    1. Nishibori, M., Mori, S., and Takahashi, H. K. (2005) J. Pharmacol. Sci. 97 25–30 - PubMed
    1. Bertog, M., Letz, B., Kong, W., Steinhoff, M., Higgins, M. A., Bielfeld-Ackermann, A., Fromter, E., Bunnett, N. W., and Korbmacher, C. (1999) J. Physiol. (Lond.) 521 3–17 - PMC - PubMed

Publication types

LinkOut - more resources