. 2008 Oct 10;283(41):27688-27697.
doi: 10.1074/jbc.M804268200. Epub 2008 Aug 4.

Inactivation of UCP1 and the glycerol phosphate cycle synergistically increases energy expenditure to resist diet-induced obesity

Affiliations

Inactivation of UCP1 and the glycerol phosphate cycle synergistically increases energy expenditure to resist diet-induced obesity

Rea Anunciado-Koza et al. J Biol Chem. .

Abstract

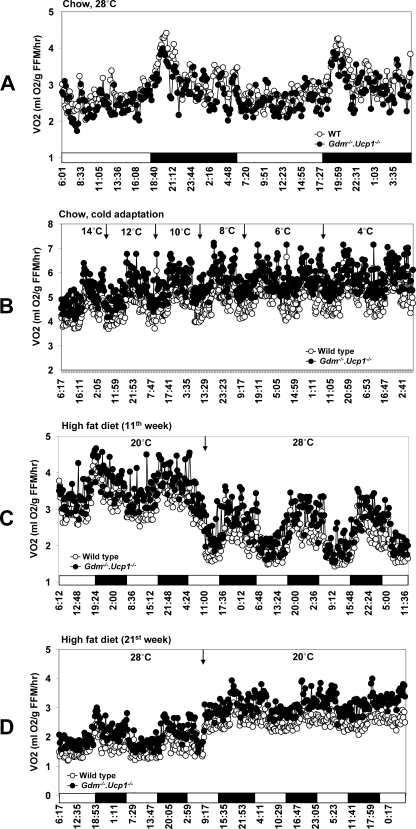
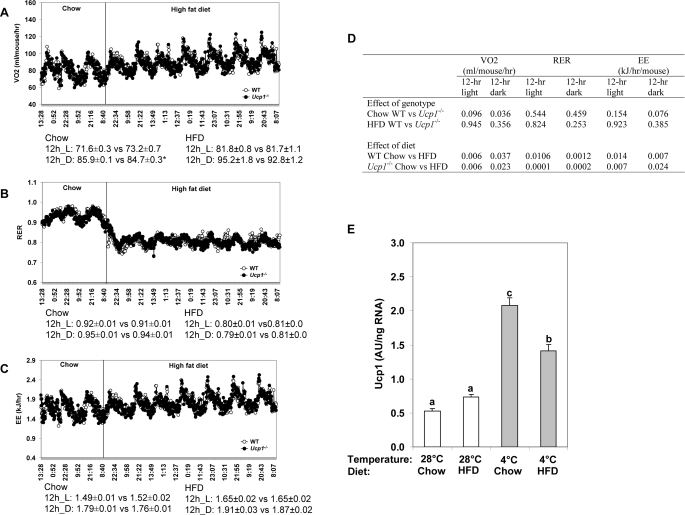
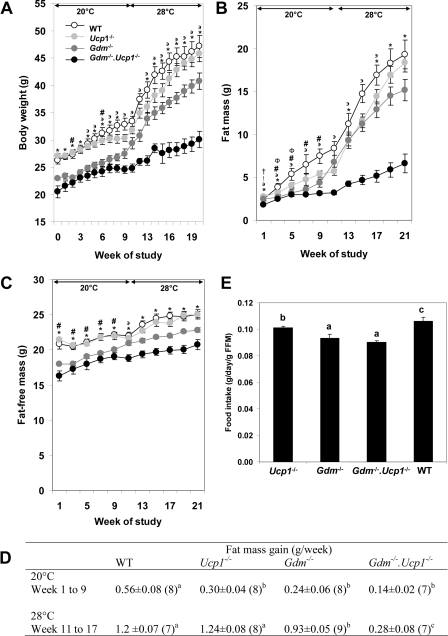
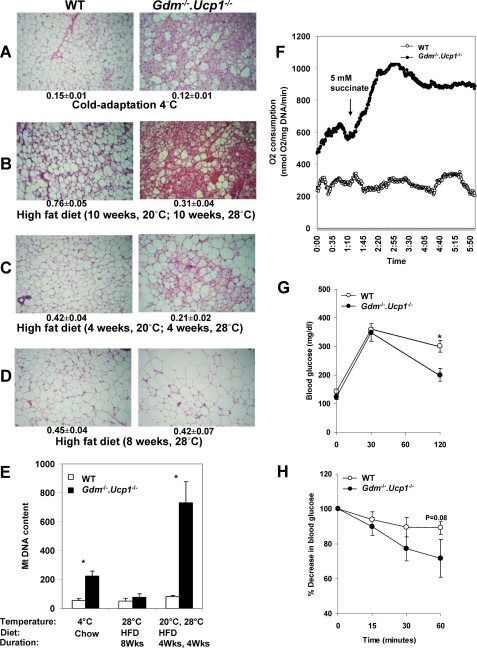
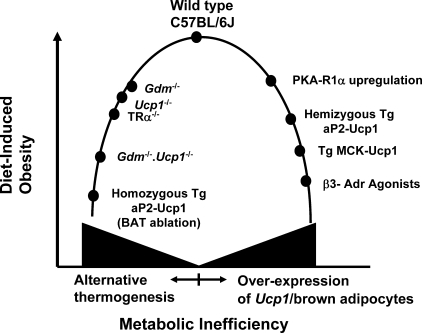
Our current paradigm for obesity assumes that reduced thermogenic capacity increases susceptibility to obesity, whereas enhanced thermogenic capacity protects against obesity. Here we report that elimination of two major thermogenic pathways encoded by the mitochondrial uncoupling protein (Ucp1) and mitochondrial glycerol-3-phosphate dehydrogenase (Gdm) result in mice with increased resistance to diet-induced obesity when housed at 28 degrees C, provided prior adaptation occurred at 20 degrees C. Obesity resistant Gdm(-/-).Ucp1(-/-) mice maintained at 28 degrees C have increased energy expenditure, in part through conversion of white to brown adipocytes in inguinal fat. Increased oxygen consumption in inguinal fat cell suspensions and the up-regulation of genes of mitochondrial function and fat metabolism indicated increased thermogenic activity, despite the absence of UCP1, whereas liver and skeletal muscle showed no changes in gene expression. Additionally, comparisons of energy expenditure in UCP1-deficient and wild type mice fed an obesogenic diet indicates that UCP1-based brown fat-based thermogenesis plays no role in so-called diet-induced thermogenesis. Accordingly, a new paradigm for obesity emerges in which the inactivation of major thermogenic pathways force the induction of alternative pathways that increase metabolic inefficiency.


Figures

FIGURE 1.
FIGURE 1.
Effect of diet and ambient temperature on oxygen consumption (VO2) in WT and Gdm-/-·Ucp1-/- mice. A, mice were fed chow diet and kept at 28 °C. B, mice were acclimated to cold until ambient temperature reached 4 °C. C and D, mice were fed a high fat diet for 20 weeks and reared at 20 °C for 10 weeks and at 28 °C for 10 weeks. At the 11th week of the experiment, the temperature was switched from 20 to 28 °C (C). At the 21st week, temperature was switched from 28 to 20 °C (D).
FIGURE 2.
FIGURE 2.
Analysis of diet-induced thermogenesis in Ucp1-/- and wild type mice. Effect of chow and high fat diet (HFD) on oxygen consumption (VO2) (A), RER (B), and energy expenditure (C) in WT (n = 8; body weight = 29.7 ± 0.01) and Ucp1-/- (n = 8; body weight = 28.4 ± 0.73) mice at 23 °C. The values presented under each graph correspond to the means ± S.E. in WT and Ucp1-/-, respectively. *, p < 0.05. D, statistical analysis (p values) for the effects of genotype and diet on VO2, RER, and energy expenditure. E, effect of ambient temperature (28 °C versus 4 °C) and diet (chow versus high fat diet) on Ucp1 gene expression in brown adipose tissue of WT mice (n = 9/group). The mice were fed chow or high fat diet (HFD) and kept at 4 or 28 °C ambient temperature for 1 week. a, b, and c indicate means that are statistically significant at p < 0.05.
FIGURE 3.
FIGURE 3.
Phenotypes of energy balance in wild type, Ucp1-/-, Gdm-/-, and Gdm-/-·Ucp1-/- mice. Shown is the effect of a high fat diet on body weight (A), fat mass (B), fat-free mass (C), rate of fat mass gain (D), and food intake (E) in WT (n = 7–8), Ucp1-/- (n = 8), Gdm-/- (n = 8–9), and Gdm-/-·Ucp1-/- (n = 7) mice kept at 20 °C for 10 weeks and at 28 °C for 10 weeks. The data represent means ± S.E. The following symbols indicate no significant difference between groups: *, WT versus Ucp1-/-; #, Gdm-/- versus Gdm-/-·Ucp1-/-; formula image, Gdm-/- versus Ucp1-/-; †, WT versus Gdm-/-; Φ, Gdm-/-·Ucp1-/- versus Ucp1-/-; !, WT versus Gdm-/-·Ucp1-/-. a, b, and c indicate means that are statistically significant at p < 0.05 (D and E).
FIGURE 4.
FIGURE 4.
Evidence showing increased energy expenditure from the inguinal fat of Gdm-/-·Ucp1-/- mice and increased insulin sensitivity. A–D, histology of the inguinal fat. A representative section is shown for each experimental group. Adiposity index corresponding to the ratio between fat mass and fat-free mass (AI, mean ± S.E.) is shown below each panel. The number of mice used for each experiment (A, WT = 6 versus Gdm-/-·Ucp1-/- = 5; B, WT = 7 versus Gdm-/-·Ucp1-/- = 7; C, WT = 5 versus Gdm-/-·Ucp1-/- = 5; D, WT = 5 versus Gdm-/-·Ucp1-/- = 5). E, inguinal fat mitochondrial DNA content is the ratio between MT-encoded mt-co2 and nucleus-encoded Ucp2. The values represent the means ± S.E. *, p < 0.05. F, mean tissue O2 consumption in inguinal fat measured with a Clark-type electrode in WT (n = 4) and Gdm-/-·Ucp1-/- (n = 3) mice fed a high fat diet for 4 weeks at 20 °C and 4 weeks at 28 °C. G and H, blood glucose profile during intraperitoneal glucose tolerance test (G) and insulin tolerance test (H) in WT and Gdm-/-·Ucp1-/- mice (n = 6–7/group) after 20 weeks on high fat diet. The mice were kept at 20 °C for 10 weeks and 28 °C for 10 weeks. The values correspond to the means ± S.E.; *, p < 0.05.
FIGURE 5.
FIGURE 5.
Model describing the relationship between metabolic inefficiency and sensitivity to DIO in male C57BL/6J. On the one hand, metabolic inefficiency can be increased by inactivating major thermogenic pathways, thereby forcing the animal to utilize alternative thermogenic pathways that cost more energetically to maintain body temperature, thus reducing the level of DIO. On the other hand, overexpression and/or ectopic expression of Ucp1 or induction of brown adipocytes in white fat depots enhances the thermogenic capacity, much of which, by being unregulated, increases metabolic inefficiency and reduces diet-induced obesity. References documenting the obesity and thermogenic phenotypes are as follows: wild type C57BL/6J (48), Gdm-/- (17), Ucp1-/- (15), TRα-/- (49), Gdm-/-·Ucp1-/-, homozygous Tg aP2-Ucp1 (50), cAMP-dependent protein kinase-R1α regulation (38, 39), hemizygous aP2-Ucp1 (51), TG MCK-Ucp1 (52), and β3-Adr agonists (–55).

Similar articles

Cited by

References

    1. Blundell, J., and Stubbs, J. (2004) in Handbook of Obesity (Bray, G., and Bouchard, C., eds) 2nd Ed., pp. 427-460, Marcel Dekker, Inc., New York
    1. Schutz, Y., and Jequier, E. (2004) in Handbook of Obesity (Bray, G., and Bouchard, C., eds) 2nd Ed., pp. 615-629, Marcel Dekker, Inc., New York
    1. Hill, J., Saris, W., and Levine, J. (2004) in Handbook of Obesity (Bray, G., and Bouchard, C., eds) 2nd Ed., pp. 631-653, Marcel Dekker, Inc., New York
    1. Lowell, B. B., and Spiegelman, B. M. (2000) Nature 404 652-660 - PubMed
    1. Schwartz, M. W., Woods, S. C., Seeley, R. J., Barsh, G. S., Baskin, D. G., and Leibel, R. L. (2003) Diabetes 52 232-238 - PubMed

Publication types

MeSH terms