. 2008 Aug 12;105(32):11358-63.
doi: 10.1073/pnas.0804632105. Epub 2008 Aug 4.

Demyelination arrest and remyelination induced by glatiramer acetate treatment of experimental autoimmune encephalomyelitis

Affiliations

Demyelination arrest and remyelination induced by glatiramer acetate treatment of experimental autoimmune encephalomyelitis

Rina Aharoni et al. Proc Natl Acad Sci U S A. .

Abstract

The interplay between demyelination and remyelination is critical in the progress of multiple sclerosis (MS) and its animal model, experimental autoimmune encephalomyelitis (EAE). In the present study, we explored the capacity of glatiramer acetate (GA, Copaxone) to affect the demyelination process and/or lead to remyelination in mice inflicted by chronic EAE, using both scanning electron microscopy and immunohistological methods. Spinal cords of untreated EAE mice revealed substantial demyelination accompanied by tissue destruction and axonal loss. In contrast, in spinal cords of GA-treated mice, in which treatment started concomitantly with disease induction (prevention), no pathology was observed. Moreover, when treatment was initiated after the appearance of clinical symptoms (suppression) or even in the chronic disease phase (delayed suppression) when substantial demyelination was already manifested, it resulted in a significant decrease in the pathological damage. Detection of oligodendrocyte progenitor cells (OPCs) expressing the NG2 or O4 markers via colocalization with the proliferation marker BrdU indicated their elevated levels in spinal cords of GA-treated mice. The mode of action of GA in this system is attributed to increased proliferation, differentiation, and survival of OPCs along the oligodendroglial maturation cascade and their recruitment into injury sites, thus enhancing repair processes in situ.


Conflict of interest statement

Conflict of interest statement: Michael Sela and Ruth Arnon are among the inventors of Copaxone.

Figures
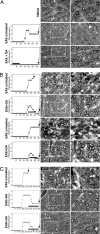
Fig. 1.
Fig. 1.
The effect of GA on myelin visualized by wet SEM. Shown are series of wet SEM SC images (cervix) from representative mice, in magnifications of 800× (Center) and 1600× (Right), and their respective patterns of clinical daily scoring. (A) Prevention regimen: GA treatment started together with disease induction (eight daily injections). (B) Suppression regimen, started after the appearance of clinical symptoms (10 daily injections). (C) Delayed suppression regimen, started one month after disease induction (18 daily injections). In EAE mice, the myelin is reduced and accompanied by inflammation (white spots) and axonal loss (dark holes). In the SCs of EAE+GA mice, the myelin is preserved and no pathology is observed. Arrows indicate the day of perfusion. GA treatment is indicated by a dark line. (Scale bars: 20 μm, Center; 10 μm, Right.)
Fig. 2.
Fig. 2.
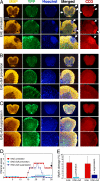
Immunohistochemical characterization of SCs from EAE mice and the effect of GA treatment. SC sections from EAE induced YFP 2.2 mice, expressing YFP (green) on their neuronal population, were stained for myelin by using anti-MBP antibodies (yellow), overall cell nuclei by using Hoechst (blue), and T cells by using anti-CD3 antibodies (red). (A–C) Corresponding coronal sections from: (A) An untreated EAE induced mouse, (B) An EAE induced mouse treated by GA (prevention regimen), and (C) an EAE induced mouse treated by GA (suppression regimen). Multiple demyelination sites are accompanied by fiber deterioration and overall cell/T cell infiltration in the EAE untreated mouse (indicated by arrows), in contrast to the minute damage detected in the GA treated mice. Scale bars; 250 μm (Top), 100 μm (Middle), 50 μm (Bottom). (D) Treatment schedules and daily clinical score. (E) Quantitative analysis of myelin damages performed by measuring the area of MBP destruction in 16 sagittal sections along each SC (two mice per treatment group). Asterisk indicates significant reduction from untreated EAE mice.
Fig. 3.
Fig. 3.
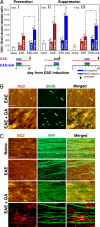
The effect of GA on NG2-expressing oligodendrocyte progenitor cells. (A) Quantitative analysis of double-labeled NG2 and BrdU cells in the SCs of naïve, EAE induced, and EAE induced mice treated with GA, in normal-appearing white matter (nwm) or in damage regions (lesions), counted in a field of 0.03 mm2 (25–50 regions along the cervix of each SC, 3–5 mice per treatment group). The respective experimental schedule illustrates GA and BrdU administration by eight injections either as prevention starting at disease induction on day 0 (experiment I) or as suppression starting one day after the appearance of clinical manifestations on day 14 (experiment II) and on day 19 (experiment III). The pound symbols indicate significant elevation from naïve mice, and the asterisks indicate significant elevation from untreated EAE mice. (B) The effect of GA on the morphology of OPCs stained for NG2 expression (orange) and BrdU incorporation (green). In untreated mice, NG2-expressing cells have bipolar progenitor morphology and multiprocessed morphology in GA treated mice. (C) SC sections from YFP 2.2 mice expressing YFP (green) on their neuronal population stained for NG2 (orange), demonstrating accumulation in sites of fiber aberration and multiprocessed preoligodendrocyte morphology after GA treatment. (Sagittal sections; scale bars: 25 μm for B and C first to third rows and 10 μm for C fourth row.)
Fig. 4.
Fig. 4.
The effect of GA on O4-expressing oligodendrocytes. (A) Quantitative analysis of double-labeled O4 and BrdU cells in the SCs of naïve, EAE induced, and EAE induced mice treated by GA in normal-appearing white matter (nwm) or in damage regions (lesions), counted in fields of 0.03 mm2 (25–50 along the cervix of each SC, 3–5 mice per treatment group). The experimental schedule is illustrated in Fig. 3A. (B) SC sections from YFP 2.2 mice demonstrating elevation of O4-expressing cells in EAE induced mice treated with GA and their accumulation in a lesion. Scale bar, 25 μm.

References

    1. Lassmann H. In: McAlpin's Multiple Sclerosis. Compston A, et al., editors. Oxford: Churchill Livingstone; 1998. pp. 323–358.
    1. Lassmann H. Experimental models of multiple sclerosis. Rev Neurol. 2007;163:651–655. - PubMed
    1. Baumann N, Phan-Dinh D. Biology of oligodendrocyte and myelin in the mammalian central nervous system. Physiol Rev. 2001;81:871–926. - PubMed
    1. Bruck W, Kuhlmann T, Stadelmann C. Remyelination in multiple sclerosis. J Neurol Sci. 2003;206:181–185. - PubMed
    1. Reynolds R, et al. The response of NG2-expressing oligodendrocyte progenitors to demyelination in MOG-EAE and MS. J Neurocytol. 2002;31:523–536. - PubMed

Publication types

MeSH terms