

The role of pulse duration and stimulation duration in maximizing the normalized torque during neuromuscular electrical stimulation
- PMID: 18678958
- PMCID: PMC2554670
- DOI: 10.2519/jospt.2008.2734
The role of pulse duration and stimulation duration in maximizing the normalized torque during neuromuscular electrical stimulation
Abstract
Study design: Controlled laboratory study
Objectives: To determine the effects of pulse duration and stimulation duration on the evoked torque after controlling for the activated area by using magnetic resonance imaging (MRI).
Background: Neuromuscular electrical stimulation (NMES) is commonly used in the clinic without considering the physiological implications of its parameters.
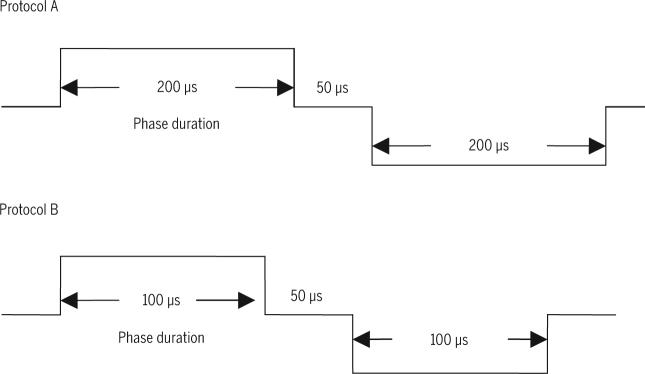
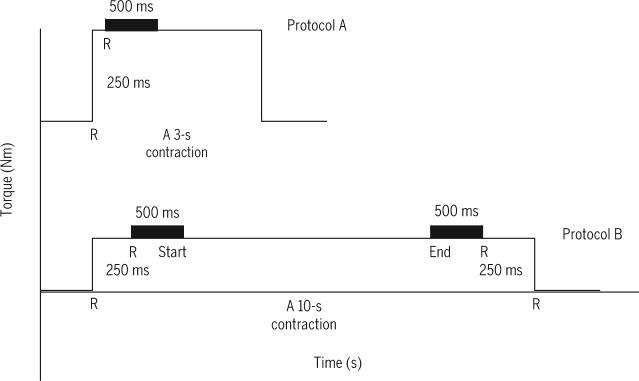
Methods and measures: Seven able-bodied, college students (mean +/- SD age, 28 +/- 4 years) participated in this study. Two NMES protocols were applied to the knee extensor muscle group in a random order. Protocol A applied 100-Hz, 450-microsecond pulses for 5 minutes in a 3-seconds-on 3-seconds-off duty cycle. Protocol B applied 60-Hz, 250-microsecond pulses for 5 minutes in a 10-seconds-on 20-seconds-off duty cycle. The amplitude of the current was similar in both protocols. Torque, torque time integral, and normalized torque for the knee extensors were measured for both protocols. MRI scans were taken prior to, and immediately after, each protocol to measure the cross-sectional area of the stimulated muscle.
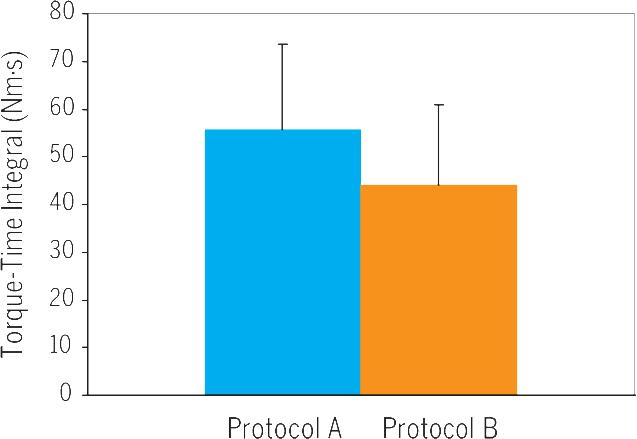
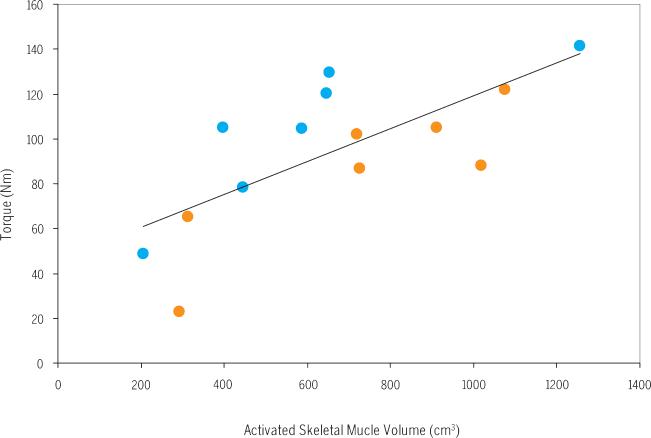
Results: The skeletal muscle cross-sectional areas activated after both protocols were similar. The longer pulse duration in protocol A elicited 22% greater torque output than that of protocol B (P<.05). After considering the activated area in both protocols, the normalized torque with protocol A was 38% greater than that with protocol B (P<.05). Torque time integral was 21% greater with protocol A (P = .029). Protocol B failed to maintain torque at the start and the end of the 10-second activation.
Conclusions: Longer pulse duration, but not stimulation duration, resulted in a greater evoked and normalized torque compared to the shorter pulse duration, even after controlling for the activated muscular cross-sectional areas with both protocols.
Level of evidence: Therapy, level 5.
Figures

References
-
- Adams GR, Harris RT, Woodard D, Dudley GA. Mapping of electrical muscle stimulation using MRI. J Appl Physiol. 1993;74:532–537. - PubMed
-
- Alon G. Use of neuromuscular electrical stimulation in neureorehabilitation: a challenge to all. J Rehabil Res Dev. 2003;40:ix–xii. - PubMed
-
- Alon G, Allin J, Inbar GF. Optimizing of pulse duration and pulse charge during transcutaneous electrical nerve stimulation. Aust J Physiother. 1983;29:196–210. - PubMed
-
- Bax L, Staes F, Verhagen A. Does neuromuscular electrical stimulation strengthen the quadriceps femoris? A systematic review of randomised controlled trials. Sports Med. 2005;35:191–212. - PubMed
-
- Bergstrom M, Hultman E. Energy cost and fatigue during intermittent electrical stimulation of human skeletal muscle. J Appl Physiol. 1988;65:1500–1505. - PubMed
Publication types
MeSH terms
Grants and funding
LinkOut - more resources
Full Text Sources
Medical
Research Materials