Placental expression of ceruloplasmin in pregnancies complicated by severe preeclampsia
- PMID: 18679377
- PMCID: PMC2682720
- DOI: 10.1038/labinvest.2008.74
Placental expression of ceruloplasmin in pregnancies complicated by severe preeclampsia
Abstract
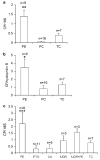
There is consensus that ischemia/reperfusion injury associated with preeclampsia (PE) promotes both placental damage and the release of factors leading to maternal endothelium dysfunction, a hallmark of this potentially life-threatening syndrome. These factors include plasminogen activator inhibitor-1 (PAI-1) and soluble fms-like tyrosine kinase-1 (sFlt-1). The goal of this study was to further characterize placental factors involved in the pathophysiology of PE. Thus, DNA microarray gene profiling was utilized to identify mRNA differentially regulated in placentas from women with severe PE compared to both preterm (PC) and term control (TC) groups. Microarray studies detected an upregulation of mRNA for ceruloplasmin, a copper-containing iron transport protein with antioxidant ferroxidase properties, in PE compared to PC and TC placentas, respectively. Quantitative real-time PCR confirmed these results by demonstrating significant increases in ceruloplasmin mRNA in PE vs PC and TC placentas. Supporting previous reports, the expression of sFlt-1 and PAI-1 were also upregulated in PE placentas. Immunohistochemistry localized ceruloplasmin to the intervillous space in PE and PC placentas, whereas stronger syncytial staining was noted in PE. Western blotting confirmed a significant increase in ceruloplasmin levels in placental tissue in PE compared to PC groups. PCR identified the presence of mRNA for ceruloplasmin in primary cultures of syncytiotrophoblasts, but not villous-derived fibroblasts, suggesting that syncytium is the site of ceruloplasmin synthesis in placenta. Hypoxic treatment (1% O(2)) of syncytiotrophoblasts enhanced levels of ceruloplasmin mRNA approximately 25-fold, a significantly greater upregulation than that noted for PAI-1 and sFlt-1, suggesting that enhanced ceruloplasmin expression is a sensitive marker of syncytial hypoxia. We suggest that syncytial ceruloplasmin and its associated ferroxidase activity, induced by the hypoxia accompanying severe PE, is important in an endogenous cellular program to mitigate the damaging effects of subsequent reperfusion injury at this site.
Figures


Similar articles
-
Role of the syncytium in placenta-mediated complications of preeclampsia.Thromb Res. 2009 Sep;124(4):389-92. doi: 10.1016/j.thromres.2009.05.016. Epub 2009 Jun 16. Thromb Res. 2009. PMID: 19535132 Free PMC article. Review.
-
Placental productions and expressions of soluble endoglin, soluble fms-like tyrosine kinase receptor-1, and placental growth factor in normal and preeclamptic pregnancies.J Clin Endocrinol Metab. 2008 Jan;93(1):260-6. doi: 10.1210/jc.2007-1550. Epub 2007 Oct 23. J Clin Endocrinol Metab. 2008. PMID: 17956952 Free PMC article.
-
Altered expression of plasminogen activator inhibitor type 1 in placentas from pregnant women with preeclampsia and/or intrauterine fetal growth retardation.Blood. 1994 Jul 1;84(1):143-50. Blood. 1994. PMID: 8018914
-
Preeclampsia is associated with the presence of transcriptionally active placental fragments in the maternal lung.Hypertension. 2013 Sep;62(3):608-13. doi: 10.1161/HYPERTENSIONAHA.113.01505. Epub 2013 Jul 1. Hypertension. 2013. PMID: 23817495
-
TGFβ signalling: a nexus between inflammation, placental health and preeclampsia throughout pregnancy.Hum Reprod Update. 2024 Jul 1;30(4):442-471. doi: 10.1093/humupd/dmae007. Hum Reprod Update. 2024. PMID: 38519450 Free PMC article. Review.
Cited by
-
Molecular Functions of Ceruloplasmin in Metabolic Disease Pathology.Diabetes Metab Syndr Obes. 2022 Mar 3;15:695-711. doi: 10.2147/DMSO.S346648. eCollection 2022. Diabetes Metab Syndr Obes. 2022. PMID: 35264864 Free PMC article. Review.
-
H19 long noncoding RNA alters trophoblast cell migration and invasion by regulating TβR3 in placentae with fetal growth restriction.Oncotarget. 2016 Jun 21;7(25):38398-38407. doi: 10.18632/oncotarget.9534. Oncotarget. 2016. PMID: 27223264 Free PMC article.
-
Focal increases of fetal macrophages in placentas from pregnancies with histological chorioamnionitis: potential role of fibroblast monocyte chemotactic protein-1.Am J Reprod Immunol. 2011 May;65(5):470-9. doi: 10.1111/j.1600-0897.2010.00927.x. Epub 2010 Nov 19. Am J Reprod Immunol. 2011. PMID: 21087336 Free PMC article.
-
Acute phase proteins are major clients for the chaperone action of α₂-macroglobulin in human plasma.Cell Stress Chaperones. 2013 Mar;18(2):161-70. doi: 10.1007/s12192-012-0365-z. Epub 2012 Aug 16. Cell Stress Chaperones. 2013. PMID: 22896034 Free PMC article.
-
Role of the syncytium in placenta-mediated complications of preeclampsia.Thromb Res. 2009 Sep;124(4):389-92. doi: 10.1016/j.thromres.2009.05.016. Epub 2009 Jun 16. Thromb Res. 2009. PMID: 19535132 Free PMC article. Review.
References
-
- Redman CW, Sargent IL. Latest advances in understanding preeclampsia. Science. 2005;308:1592–1594. - PubMed
-
- Kaufmann P, Black S, Huppertz B. Endovascular trophoblast invasion: implications for the pathogenesis of intrauterine growth retardation and preeclampsia. Biol Reprod. 2003;69:1–7. - PubMed
-
- Stepan H, Faber R, Dornhofer N, et al. New insights into the biology of preeclampsia. Biol Reprod. 2006;74:772–776. - PubMed
-
- Walsh SW, Vaughan JE, Wang Y, et al. Placental isoprostane is significantly increased in preeclampsia. FASEB J. 2000;14:1289–1296. - PubMed
-
- Myatt L, Cui X. Oxidative stress in the placenta. Histochem Cell Biol. 2004;122:369–382. - PubMed
Publication types
MeSH terms
Substances
Grants and funding
LinkOut - more resources
Full Text Sources
Miscellaneous

