

Image-guided Raman spectroscopic recovery of canine cortical bone contrast in situ
- PMID: 18679495
- PMCID: PMC2674107
- DOI: 10.1364/oe.16.012190
Image-guided Raman spectroscopic recovery of canine cortical bone contrast in situ
Abstract
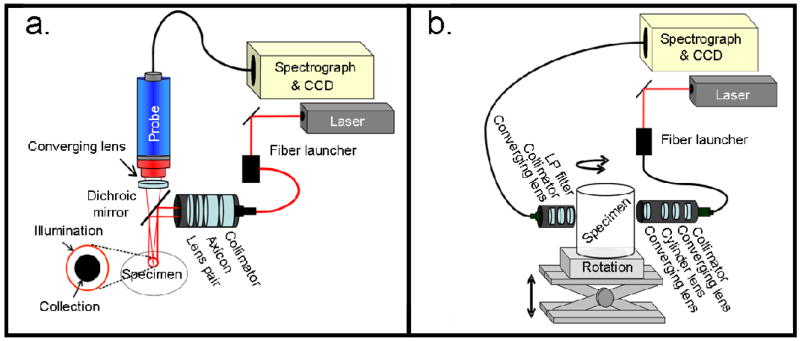
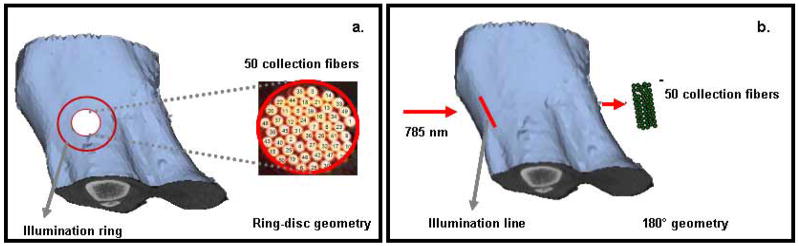
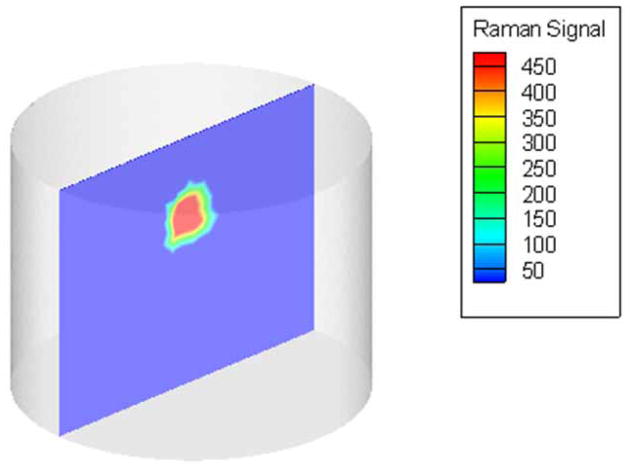
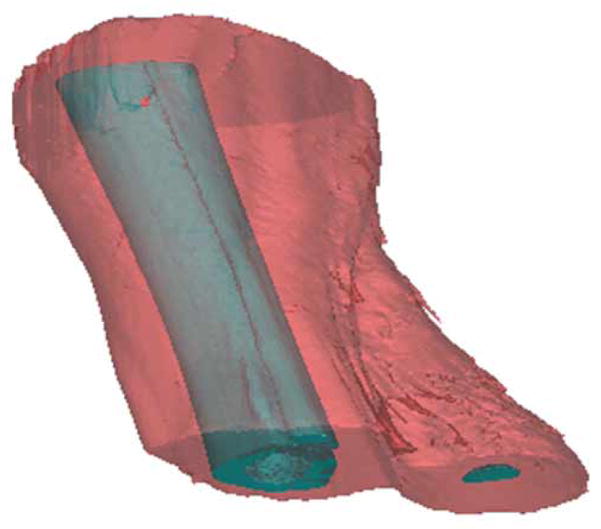
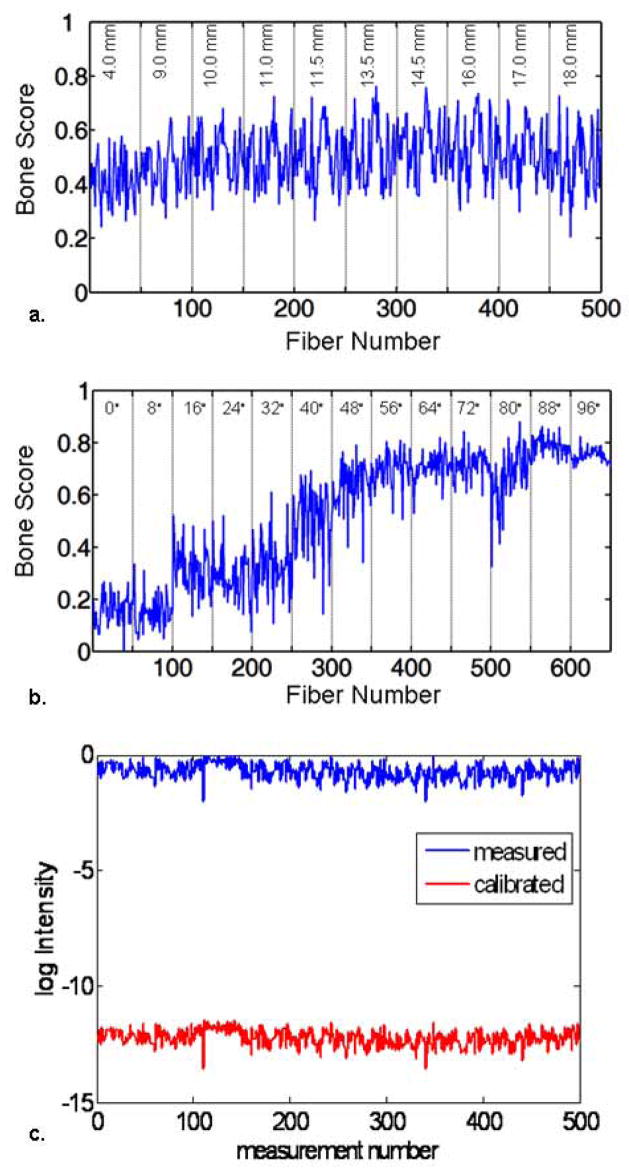
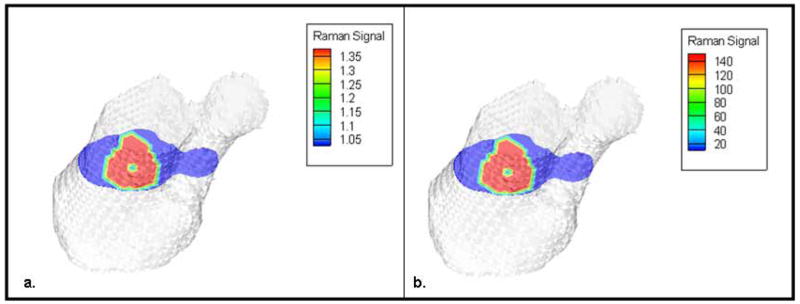
Raman scattering provides valuable biochemical and molecular markers for studying bone tissue composition with use in predicting fracture risk in osteoporosis. Raman tomography can image through a few centimeters of tissue but is limited by low spatial resolution. X-ray computed tomography (CT) imaging can provide high-resolution image-guidance of the Raman spectroscopic characterization, which enhances the quantitative recovery of the Raman signals, and this technique provides additional information to standard imaging methods. This hypothesis was tested in data measured from Teflon tissue phantoms and from a canine limb. Image-guided Raman spectroscopy (IG-RS) of the canine limb using CT images of the tissue to guide the recovery recovered a contrast of 145:1 between the cortical bone and background. Considerably less contrast was found without the CT image to guide recovery. This study presents the first known IG-RS results from tissue and indicates that intrinsically high contrasts (on the order of a hundred fold) are available.
Figures
References
-
- Poplack SP, Paulsen KD, Hartov A, Meaney PM, Pogue BW, Tosteson TD, Grove MR, Soho SK, Wells WA. Electromagnetic breast imaging: average tissue property values in women with negative clinical findings. Radiology. 2004;231:571–580. - PubMed
-
- Carpenter C, Pogue BW, Jiang S, Dehghani H, Wang X, Paulsen KD, Wells WA, Forero J, Kogel C, Weaver J, Poplack SP, Kaufman PA. Image-guided optical spectroscopy provides molecular-specific information in vivo: MRI-guided spectroscopy of breast cancer hemoglobin, water & scatterer Size. Opt Lett. 2007;32:933–935. - PubMed
-
- Zhang Q, Brukilacchio TJ, Li A, Stott JJ, Chaves T, Hillman E, Wu T, Chorlton M, Rafferty E, Moore RH, Kopans DB, Boas DA. Coregistered tomographic x-ray and optical breast imaging: initial results. J Biomed Opt. 2005;10:024033–0240339. - PubMed
-
- Davis SC, Dehghani H, Wang J, Jiang S, Pogue BW, Paulsen KD. Image-guided diffuse optical fluorescence tomography implemented with Laplacian-type regularization. Opt Express. 2007;15:4066–4082. - PubMed
Publication types
MeSH terms
Grants and funding
LinkOut - more resources
Full Text Sources
