. 2009 Apr;26(2):203-18.
doi: 10.1007/s10827-008-0107-5. Epub 2008 Aug 5.

Contextual modulation of V1 receptive fields depends on their spatial symmetry

Affiliations

Contextual modulation of V1 receptive fields depends on their spatial symmetry

Tatyana O Sharpee et al. J Comput Neurosci. 2009 Apr.

Abstract

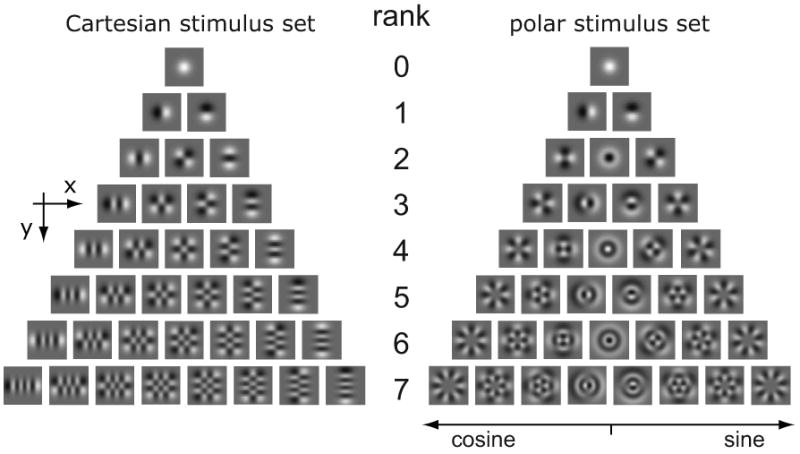
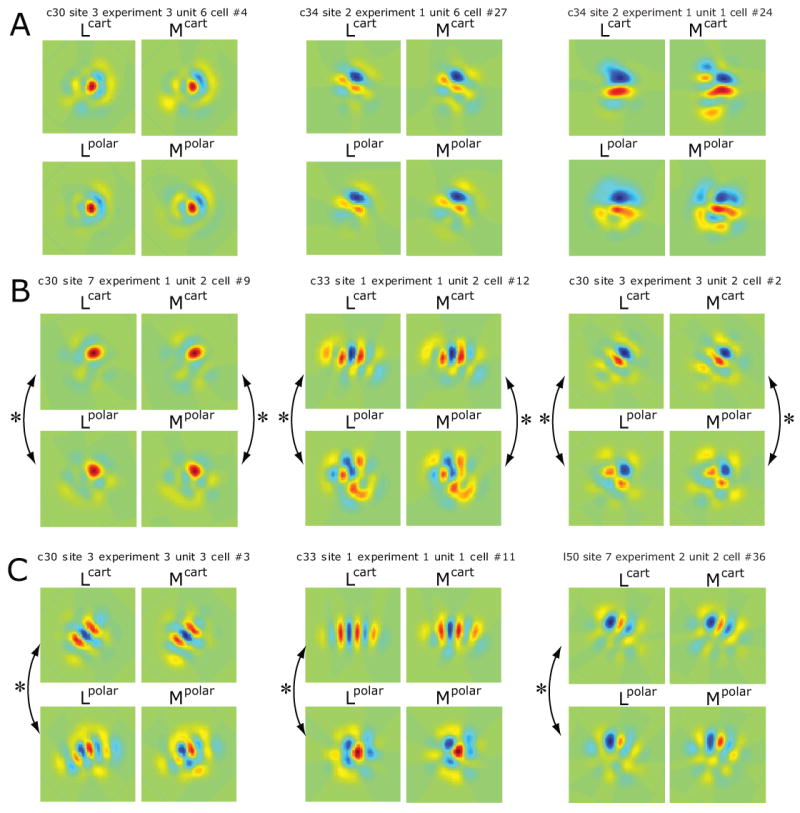
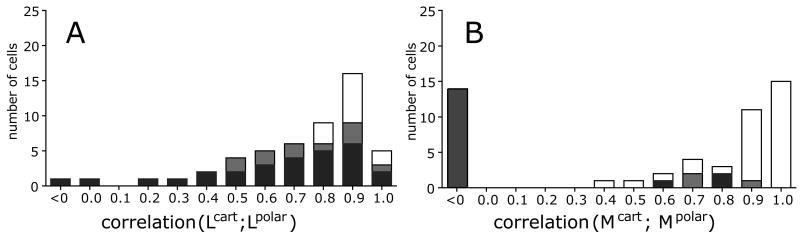
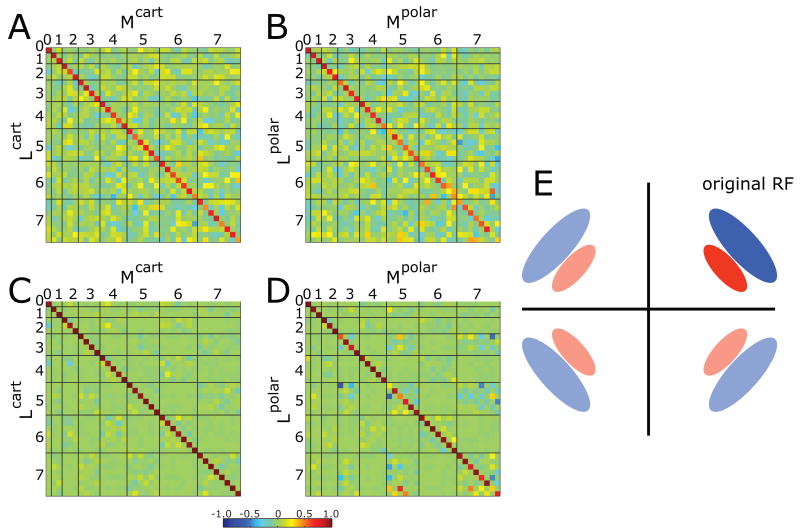
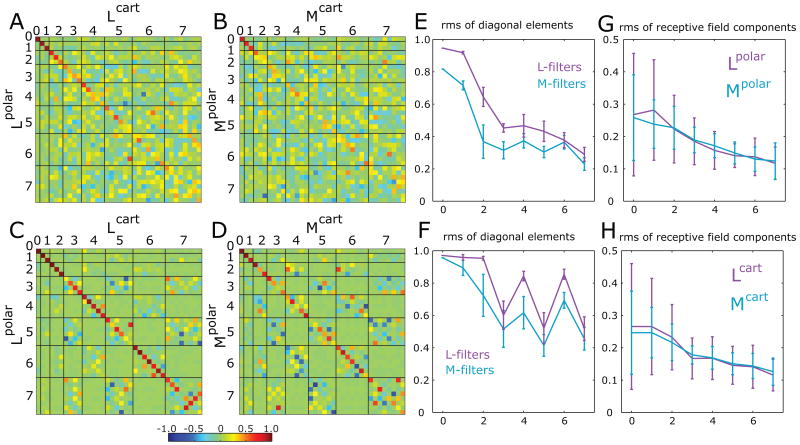
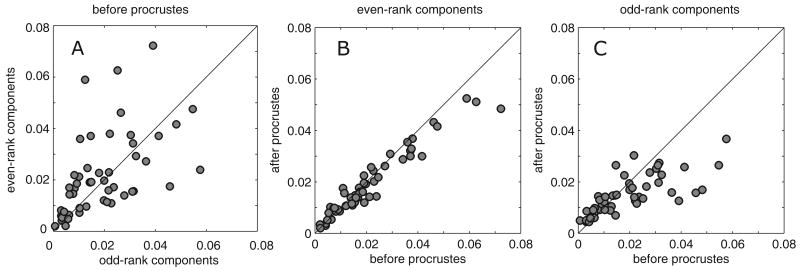
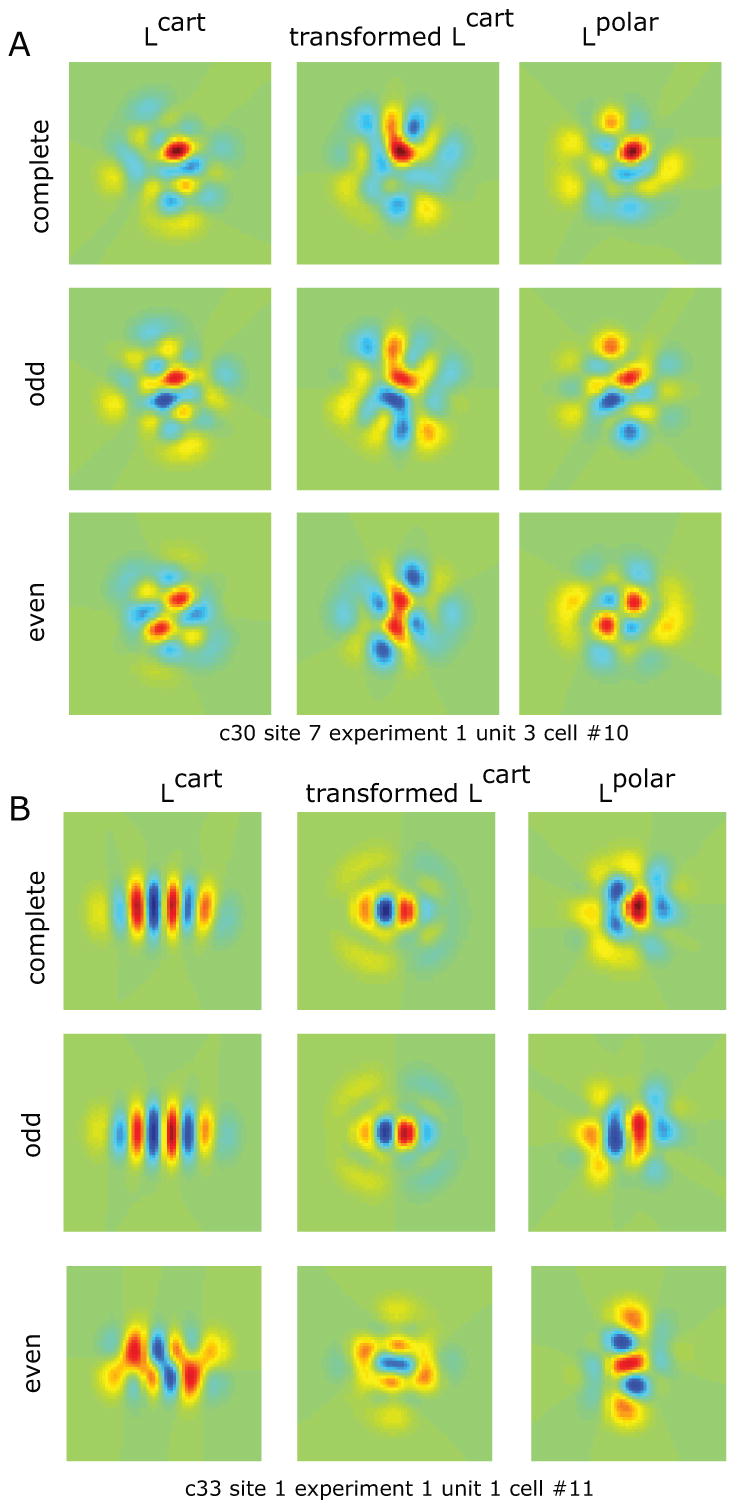
The apparent receptive field characteristics of sensory neurons depend on the statistics of the stimulus ensemble--a nonlinear phenomenon often called contextual modulation. Since visual cortical receptive fields determined from simple stimuli typically do not predict responses to complex stimuli, understanding contextual modulation is crucial to understanding responses to natural scenes. To analyze contextual modulation, we examined how apparent receptive fields differ for two stimulus ensembles that are matched in first- and second-order statistics, but differ in their feature content: one ensemble is enriched in elongated contours. To identify systematic trends across the neural population, we used a multidimensional scaling method, the Procrustes transformation. We found that contextual modulation of receptive field components increases with their spatial extent. More surprisingly, we also found that odd-symmetric components change systematically, but even-symmetric components do not. This symmetry dependence suggests that contextual modulation is driven by oriented On/Off dyads, i.e., modulation of the strength of intracortically-generated signals.


Figures

Figure 1
Figure 1. Stimulus patterns used in these experiments
Stimuli were two-dimensional Hermite functions (Victor et al., 2006). Cartesian stimuli (left panel) are products of one-dimensional Hermite functions in vertical and horizontal coordinates. Each row contains all the Cartesian stimuli of a given rank. Linear combinations of patterns of the same rank can be constructed to be separable in radial and angular coordinates. These are the polar stimuli (right panel). Modified with permission from (Victor et al., 2006).
Figure 2
Figure 2. Comparison of receptive fields for Cartesian and polar stimuli computed within two models
A: Cells with no consistent differences between receptive fields determined from Cartesian or polar basis sets by reverse correlation (L-filters) or MID (M-filters). Lcart: linear filter derived from reverse correlation of Cartesian responses; Mcart : filter derived from MID analysis of Cartesian responses; Lpolar: linear filter derived from reverse correlation of polar responses; Mpolar : filter derived from MID analysis of polar responses. Correlation coefficients of filters determined from the two stimulus contexts (Lcart vs. Lpolar, Mcart vs. Mpolar) were not significantly different from 1. L-filters (from left to right): 0.89±0.09, 0.97±0.02, 0.92±0.05 (all p>0.05); M-filters: 0.92±0.07, 0.991±0.009, 0.99±0.01 (all p>0.05). B: Cells with context-dependent receptive fields as determined by reverse correlation (L-filters) and MID (M-filters). Correlation coefficients of filters determined from the two stimulus contexts were all significantly different from 1 (marked by arrows). L-filters: 0.89±0.03 (p<0.01), 0.70±0.10 (p<0.01), 0.73±0.08 (p<0.05); M-filters: 0.70±0.10 (p<0.05), 0.92±0.04 (p<0.05), 0.60±0.10 (p<0.01). C: Cells with context-dependence of receptive fields as determined by reverse correlation (L-filters) but not by MID (M-filters). Correlation coefficients of filters determined from the two stimulus contexts were significantly different from 1 (marked by arrows) for L-filters: 0.40±0.15, 0.50±0.10, cc=0.91±0.03 (all p<0.01) but not for M-filters: 0.91±0.16, 0.98±0.03, 0.90±0.10 (all p>0.05). None of these 9 cells had consistent differences between L- and M-filters for either Cartesian or polar basis sets. Color-scale is arbitrary, but is the same for all of the four filters pertaining to a neuron. For each neuron, the color scale covers the range from the minimal to the maximal value across the four filters.
Figure 3
Figure 3. Distribution of correlation coefficients between receptive fields determined from Cartesian and polar stimulus sets
Left: stimulus-dependent changes in filters calculated by reverse correlation; right: stimulus-dependent changes in filters calculated by MID. For both kinds of models, significant context-dependent changes (correlation coefficients < 1) are prevalent. Cells with no significant changes (p>0.05) are shown in white, those with significant changes in gray (0.01
Figure 4
Figure 4. Comparison of receptive fields computed by the two models
Panels A- B: Pseudocolor display of the rotation matrix that is the optimal transformation between receptive fields estimated by two methods (reverse correlation (L-filters) and MID (M-filters)) from one set of stimuli. A: Cartesian stimuli. B: polar stimuli. Panels C and D: The same calculations, augmented by adding receptive fields reflected around horizontal and vertical axes (panel E). The heavy lines in panels A-D separate the ranks, shown increasing from 0 to 7. Within each rank, basis elements are ordered from most centrally-weighted (middle of pyramid of Figure 1 right) to most peripherally-weighted (edges of pyramid of Figure 1 right). Color scale covers the interval [-1 1], with green indicating 0, red-brown indicating 1, and blue indicating -1. The matrices are all similar to the identity matrix, indicating close correspondence between receptive fields derived by the two methods.
Figure 5
Figure 5. Comparison of receptive fields derived from Cartesian and polar stimuli
Panels A-B: Pseudocolor display of the rotation matrix that is the optimal transformation between a set of receptive fields determined from responses to the two contexts (Cartesian vs. polar) with either modeling method: L-filters (panel A) or M-filters (panel B). Panels C and D: The same calculations, augmented by adding receptive fields reflected around the vertical and horizontal axes. For both models, rotation matrices show that odd-ranked coefficients change more between Cartesian and polar stimuli than the even-ranked coefficients. Display details as in Figure 4. E: root-mean-square (rms) of rotation matrix diagonal elements at each rank, derived from L-filters (magenta, based on panel A) and M-filters (blue, based on panel B). Panel F shows the analogous rms values computed using the symmetry-augmented datasets, taken from panels C and D. Error bars in panels E and F show standard errors of the mean within each rank. The decrease in the amplitude of diagonal values is strongly non-monotonic: odd ranks are further from the identity than even ranks, showing that odd ranks have a greater systematic context-dependence than even ranks. Panels G and H show the overall magnitude of the receptive field components derived from responses to Cartesian and polar stimuli. Error bars in panels G and H show standard deviations across different cells and components within a given rank. The difference between even and odd rank receptive field components in E and F is not explained by the difference in their magnitude or estimation error, which changes monotonically.
Figure 6
Figure 6. Analysis of context-dependent changes in receptive fields according to symmetry
Panel A shows the overall context-dependent change in receptive fields broken down by the parity of the basis element, and quantified as the mean square difference per basis element computed between components of L-filters for Cartesian and polar stimuli. Even and odd-parity components show an equal amount of overall context dependence. Panels B and C compare the overall context-dependent change (abscissa) to the context-dependent change that is not accounted for by the Procrustes transformation. Comparison is based on the mean square difference between components of L-filters for polar stimuli and those of L-filters for Cartesian stimuli after the Procrustes transformation. For even-parity components (Panel B), the Procrustes transformation does not account for a substantial fraction of the variance, but for the odd-parity components (Panel C), it accounts for approximately half of the variance.
Figure 7
Figure 7. Procrustes transformations for two example cells
Left column shows L-filters obtained from Cartesian stimulus set; middle column shows the effect of Procrustes transformation (Figure 5C) on these 3 different profiles, and right column shows L-filter obtained from polar stimulus set. The top row is the complete L-filter; the middle row is the odd-rank component, and the bottom row is the even-rank component. Consistent with the analysis of Figure 6, the Procrustes transformation of the Cartesian L-filter recovers some of the features of the polar L-filter for odd ranks (middle row), but not for even ranks (bottom row).

Similar articles

Cited by

References

    1. Baccus SA, Meister M. Fast and slow contrast adaptation in retinal circuitry. Neuron. 2002;36:909–919. - PubMed
    1. Bonds AB. Role of inhibition in the specification of orientation selectivity of cells in the cat striate cortex. Vis Neurosci. 1989;2:41–55. - PubMed
    1. Carandini M, Heeger DJ, Movshon JA. Linearity and Normalization in Simple Cells of the Macaque Primary visual Cortex. J Neurosci. 1997;17:8621–8644. - PMC - PubMed
    1. Carandini M, Heeger DJ, Senn W. A synaptic explanation of suppression in visual cortex. J Neurosci. 2002;22:10053–10065. - PMC - PubMed
    1. Chander D, Chichilnisky EJ. Adaptation to temporal contrast in primate and salamander retina. J Neurosci. 2001;21:9904–9916. - PMC - PubMed

Publication types