. 2008;9(8):R122.
doi: 10.1186/gb-2008-9-8-r122. Epub 2008 Aug 4.

Diarrhea as a cause of mortality in a mouse model of infectious colitis

Affiliations

Diarrhea as a cause of mortality in a mouse model of infectious colitis

Diana Borenshtein et al. Genome Biol. 2008.

Abstract

Background: Comparative characterization of genome-wide transcriptional changes during infection can help elucidate the mechanisms underlying host susceptibility. In this study, transcriptional profiling of the mouse colon was carried out in two cognate lines of mice that differ in their response to Citrobacter rodentium infection; susceptible inbred FVB/N and resistant outbred Swiss Webster mice. Gene expression in the distal colon was determined prior to infection, and at four and nine days post-inoculation using a whole mouse genome Affymetrix array.

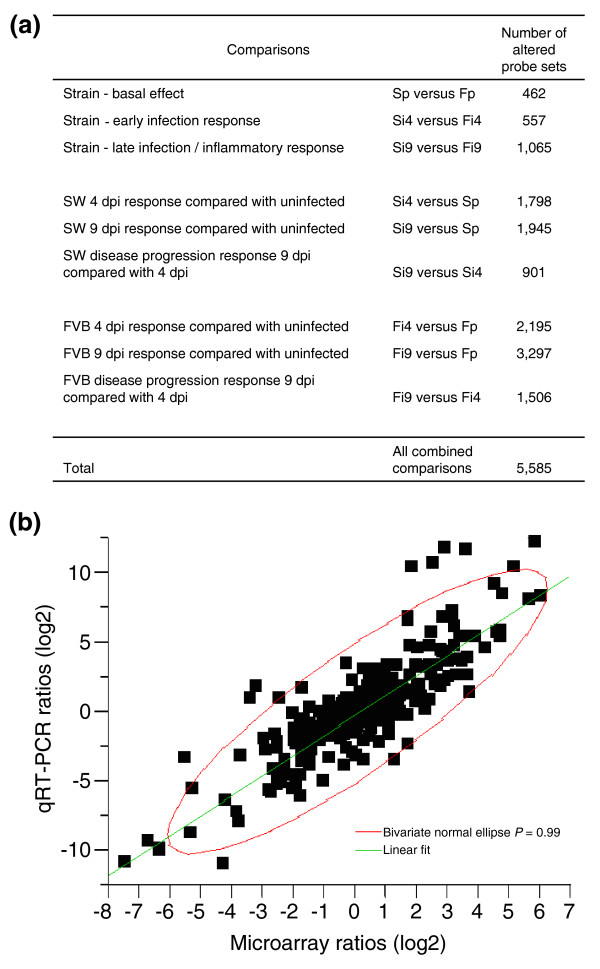
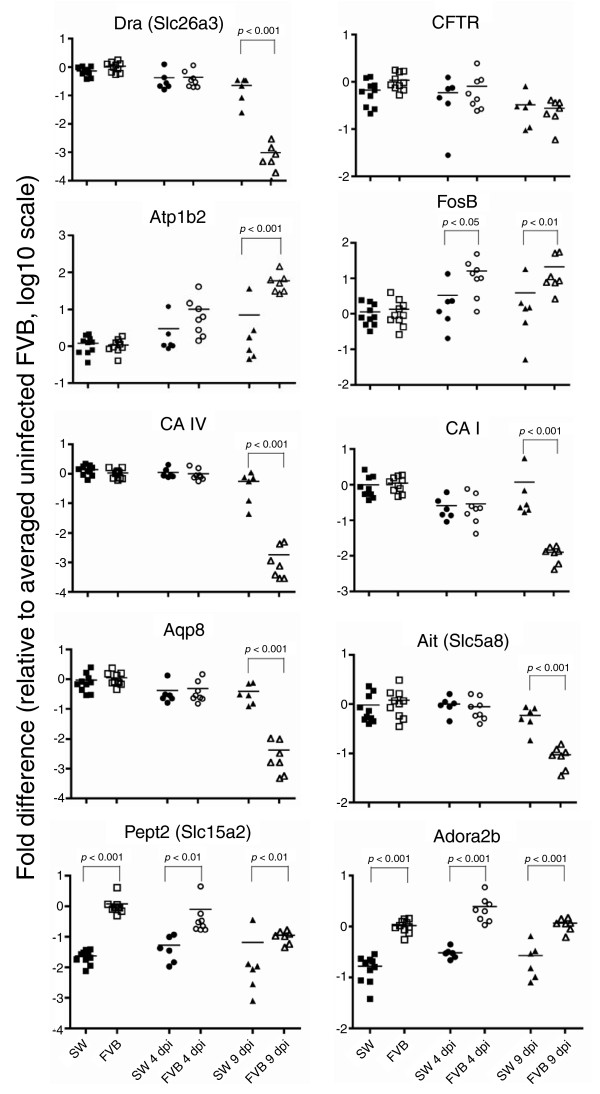
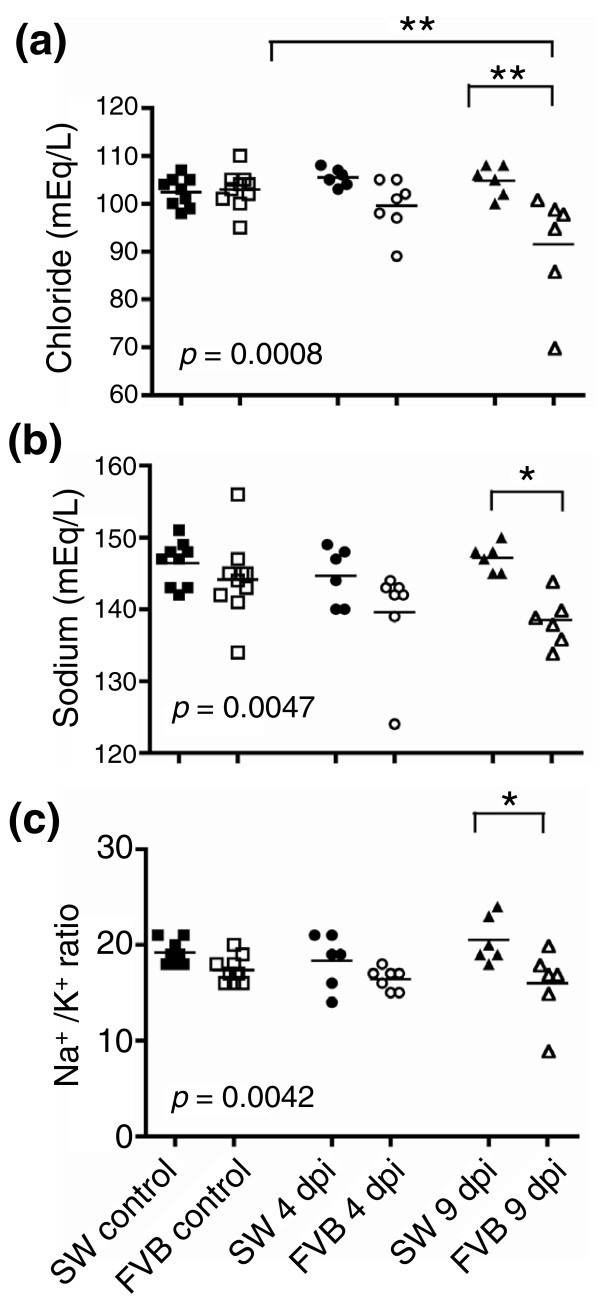
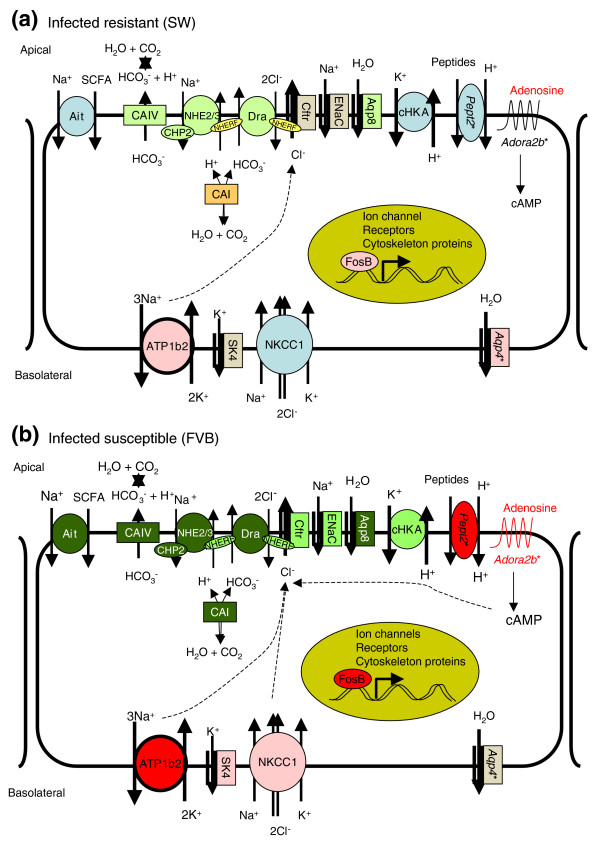
Results: Computational analysis identified 462 probe sets more than 2-fold differentially expressed between uninoculated resistant and susceptible mice. In response to C. rodentium infection, 5,123 probe sets were differentially expressed in one or both lines of mice. Microarray data were validated by quantitative real-time RT-PCR for 35 selected genes and were found to have a 94% concordance rate. Transcripts represented by 1,547 probe sets were differentially expressed between susceptible and resistant mice regardless of infection status, a host effect. Genes associated with transport were over-represented to a greater extent than even immune response-related genes. Electrolyte analysis revealed reduction in serum levels of chloride and sodium in susceptible animals.

Conclusion: The results support the hypothesis that mortality in C. rodentium-infected susceptible mice is associated with impaired intestinal ion transport and development of fatal fluid loss and dehydration. These studies contribute to our understanding of the pathogenesis of C. rodentium and suggest novel strategies for the prevention and treatment of diarrhea associated with intestinal bacterial infections.


Figures

Figure 1
Figure 1
C. rodentium infection in adult susceptible inbred FVB mice and resistant outbred SW mice. (a) Significant weight loss was observed in infected FVB mice at 8 dpi (p < 0.05). Weight was normalized and expressed as percent change of initial baseline. Red and green indicate SW and FVB mice, respectively; open and filled bars represent uninoculated and infected mice, respectively. Values are mean ± standard error of the mean. (b) Fecal bacterial counts were similar in both lines of mice at 3 dpi, but FVB mice had higher bacterial shedding at 8 dpi (p < 0.05). Bacterial counts were log10 transformed. (c) FVB mice infected with C. rodentium developed colonic inflammation that was significantly more severe than the milder colitis in SW mice at 9 dpi (p < 0.0001). (d) Infected FVB and SW mice developed comparable hyperplasia at 9 dpi. Experimental groups included 20, 10, and 7 uninoculated control, 4 dpi, and 9 dpi FVB mice, respectively, and 16, 10, and 10 SW mice in the corresponding groups. Each symbol represents one animal; filled symbols in red or green represent SW or FVB mice selected for array analysis. Mean or median lines for each group are presented. *p < 0.05; **p < 0.01.
Figure 2
Figure 2
Differential expression of genes between and within the lines of mice prior to, and in response to, C. rodentium infection. (a) Summary of transcripts differentially expressed in individual and combined comparisons. The analysis was performed using an Affymetrix whole mouse genome oligonucleotide chip (430 2.0 Array), which contains >45,000 probe sets comprising expression levels of >39,000 transcripts and variants from >34,000 well-characterized mouse genes. The normalization and processing of the results were performed using DNA-Chip Analyzer (dChip) software implementing model-based expression analysis. One percent of the total probe sets presented on the array were more than two-fold differentially expressed between SW and FVB mice prior to infection. In response to C. rodentium inoculation, 11.4% of the probe sets were either induced or repressed in one or both of the lines of mice. There were more differentially expressed genes in response to infection in susceptible FVB mice than in resistant SW mice, especially as disease progressed. Overall, alterations in 12.4% of the probe sets were detected throughout the experiment. (b) Validation of microarray results by qRT-PCR (TaqMan) of selected genes. Transcript levels were normalized to the endogenous control GAPDH, and expressed as fold change compared with untreated control FVB mice, which were set at 1, using the Comparative Ct method. The resultant log2 ratios were matched with corresponding log2 ratios detected in microarray analysis and subjected to Pearson correlation analysis. Significant correlation was observed between the two assays (Pearson correlation coefficient r = 0.87, R2 = 0.75, p < 0.0001). Pearson correlations for individual genes ranged from 0.67 to 1. Only two out of 35 examined genes did not confirm the array results, yielding a predictability rate of 94%.
Figure 3
Figure 3
Genes contributing to host susceptibility. (a) Comparative analysis of gene expression profiles of SW versus FVB genes prior to infection or at 4 and 9 dpi is shown as a Venn diagram. Overall, 1,547 genes were differentially expressed between the lines of mice (Additional data file 5) and divided into 7 distinct subsets. Group A represents genes that were differentially expressed between the mouse lines at all time points. Groups B, C, and D represent genes that were differentially expressed at two conditions/time points. Groups E, F, and G represent genes unique to uninfected status, 4 dpi and 9 dpi, respectively. Each subset represents the comparison of resistant outbred SW mice to susceptible inbred FVB mice at the indicated time point. Numbers in parentheses represent the number of differentially expressed probe sets in each group. Significantly enriched GO clusters (p < 0.05 by hypergeometric test) for each group and for all sets of genes with host effect are given in Additional data file 20. (b) PCA distinguished SW from FVB mice in PC2. PC1 established negative correlation of infected and uninoculated FVB mice, but did not discriminate SW mice by infection status. Thus, PC1 represents morbidity associated with infection. (c) The prevalence of genes within GO categories was assessed by FatiGO analysis. Only categories containing more than 5% of genes are shown. Genes from transport processes were overrepresented.
Figure 4
Figure 4
qRT-PCR of genes involved in intestinal transport and its regulation. The expression of genes was normalized to uninoculated FVB mice. Each symbol represents one animal. Lines indicate group means.
Figure 5
Figure 5
Validation of Dra and CA IV expression by immunohistochemistry. Colonic samples were stained with antibodies against (a-d) Dra or (e-h) CA IV. Normal apical expression of proteins was observed in distal colon from uninoculated SW (a,e) and FVB (b,f) mice. By 9 dpi, partial loss of protein expression was observed in infected SW mice (c,g) compared with complete lack of expression in infected FVB mice (d,h). Original magnifications are 200×.
Figure 6
Figure 6
Serum electrolyte levels. Infected FVB mice had (a) hypochloremia, (b) hyponatremia, and (c) altered Na+/K+ ratio in serum compared with infected SW mice. Each symbol represents an individual mouse; lines indicate means of the group. *p < 0.05; **p < 0.01.
Figure 7
Figure 7
Working model for the pathogenesis of colonic ion transport in fatal diarrhea in C. rodentium-infected FVB mice. Normal ion transport in the large intestine is mediated largely by the coupled action of the anion exchanger DRA, CFTR, sodium/proton exchangers NHE2/3, potassium transporters and carbonic anhydrases (see Discussion). (a) alterations in ion transport in C. rodentium-infected SW mice, including subtle decreases in expression of some apical transporters and compensatory increases in basolateral water channel Aqp4 expression. (b) Profound changes in infected FVB mice consisting of mild to marked downregulation of the majority of apical transporters involved in intestinal Na+ and Cl- absorption and bicarbonate secretion, along with upregulation of basolateral transporters providing the driving force for chloride secretion. In addition, constitutively higher levels of Pept2 and Adora2b expression in FVB mice (indicated by asterisks) can contribute to alterations in cytosolic pH and cAMP during infection, thereby further affecting ion exchange. The cumulative effect may ultimately result in severe diarrhea and lead to death in these susceptible animals. Vesicular trafficking of some proteins (A2B receptor, aquaporins, NHE3, ATPases) and paracellular transport are not addressed here. Colors indicate fold change in gene expression identified by microarray or qRT-PCR: light green ≥2-fold decrease; dark green ≥8-fold decrease; pink ≥2-fold increase; red ≥8-fold increase.

References

    1. Kosek M, Bern C, Guerrant RL. The global burden of diarrhoeal disease, as estimated from studies published between 1992 and 2000. Bull World Health Organ. 2003;81:197–204. - PMC - PubMed
    1. Casburn-Jones AC, Farthing MJ. Management of infectious diarrhoea. Gut. 2004;53:296–305. - PMC - PubMed
    1. Mello PM, Sharma VK, Dellinger RP. Shock overview. Semin Respir Crit Care Med. 2004;25:619–628. - PubMed
    1. Nataro JP, Kaper JB. Diarrheagenic Escherichia coli. Clin Microbiol Rev. 1998;11:142–201. - PMC - PubMed
    1. Berkes J, Viswanathan VK, Savkovic SD, Hecht G. Intestinal epithelial responses to enteric pathogens: effects on the tight junction barrier, ion transport, and inflammation. Gut. 2003;52:439–451. - PMC - PubMed

Publication types

MeSH terms