. 2008 Aug;124(2):1054-67.
doi: 10.1121/1.2939126.

Sources of variability in distortion product otoacoustic emissions

Affiliations

Sources of variability in distortion product otoacoustic emissions

Cassie A Garner et al. J Acoust Soc Am. 2008 Aug.

Abstract

The goal of this study was to determine the extent to which the variability seen in distortion product otoacoustic emissions (DPOAEs), among ears with normal hearing, could be accounted for. Several factors were selected for investigation, including behavioral threshold, differences in middle-ear transmission characteristics either in the forward or the reverse direction, and differences in contributions from the distortion and reflection sources. These variables were assessed after optimizing stimulus parameters for individual ears at each frequency. A multiple-linear regression was performed to identify whether the selected variables, either individually or in combination, explained significant portions of variability in DPOAE responses. Behavioral threshold at the f(2) frequency and behavioral threshold squared at that same frequency explained the largest amount of variability in DPOAE level, compared to the other variables. The combined model explained a small, but significant, amount of variance in DPOAE level at five frequencies. A large amount of residual variability remained, even at frequencies where the model accounted for significant amounts of variance.


Figures

Figure 1
Figure 1
Mean DPOAE (circles) and noise (triangles) levels as a function of L2 for each of the nine f2 frequencies. Error bars represent±1 SD.
Figure 2
Figure 2
Ld corrected plotted as a function of L2 at each of nine f2 frequencies. Each panel includes estimates of Ld from 40 subjects at each of 13 L2 levels, for a total of 520 points per panel. The dashed line at Ld corrected=0 is the mean residual variance and provides a point of reference.
Figure 3
Figure 3
Ld corrected as a function of behavioral threshold, with data at nine f2 frequencies shown separately in each panel. The line in each panel represents the quadratic function that was fitted to the data. The slope values represent the unstandardized coefficients for behavioral threshold and behavioral threshold squared, respectively. An asterisk indicates a significant relationship.
Figure 4
Figure 4
Ld corrected as a function of energy reflectance at the f2 frequency, with data at nine f2 frequencies shown in each panel. The line in each panel represents a linear fit to the data. The slope values represent the unstandardized coefficients for energy reflectance at the f2 frequency. The unstandardized coefficients were examined for all variables because not all of the independent variables share the same variance and they are based on the original, not the standardized scores of the predictor. An asterisk indicates a significant relationship.
Figure 5
Figure 5
Ld corrected as a function of admittance magnitude at the f2 frequency, with data at nine f2 frequencies shown separately in each panel. The line in each panel represents a linear fit to the data and the slope values represent the unstandardized coefficients for admittance magnitude at the f2 frequency. An asterisk indicates a significant relationship.
Figure 6
Figure 6
Ld corrected as a function of energy reflectance at the fd frequency, with data at nine f2 frequencies shown separately in each panel. The line in each panel represents a linear fit to the data and the slope values represent the unstandardized coefficients for energy reflectance at the fd frequency. An asterisk indicates a significant relationship.
Figure 7
Figure 7
Ld corrected as a function of equivalent volume at the fd frequency, with data at nine f2 frequencies shown separately in each panel. Following the same conventions as in Fig. 5, the line in each panel represents a linear fit to the data and the slope values represent the unstandardized coefficients for equivalent volume at the fd frequency. An asterisk indicates a significant relationship.
Figure 8
Figure 8
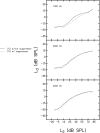
DPOAE level as a function of L2 for 1000, 2000, and 4000 Hz plotted separately in each panel. The solid line represents the DPOAE collected without a suppressor and the dashed line represents the DPOAE collected with a suppressor tone present.
Figure 9
Figure 9
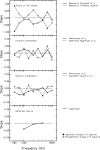
Normalized slope plotted as a function of f2 frequency. The top panel represents the status of the cochlea and plots behavioral threshold at the f2 frequency and behavioral threshold squared at that same frequency. The second panel represents middle-ear transmission in the forward direction by plotting energy reflectance and admittance magnitude at the f2 frequency. The third panel represents middle-ear transmission in the reverse direction by plotting energy reflectance and equivalent volume at fd. The bottom panel represents the reflection-source contribution. Significant values are represented by filled symbols and nonsignificant values are represented by open symbols.

References

    1. Dhar, S. and Shaffer, L. (2004). “Effects of a suppressor tone on distortion product otoacoustic emissions fine structure: Why a universal suppressor level is not a practical solution to obtaining single-generator DP-grams,” Ear Hear. EAHEDS10.1097/00003446-200412000-00006 25, 573–585. - DOI - PubMed
    1. Dorn, P. A., Konrad-Martin, D., Neely, S. T., Keefe, D. H., Cyr, E., and Gorga, M. P. (2001). “Distortion product otoacoustic emission input∕output functions in normal-hearing and hearing-impaired human ears,” J. Acoust. Soc. Am. JASMAN10.1121/1.1417524 110, 3119–3131. - DOI - PubMed
    1. Dorn, P. A., Piskorski, P., Keefe, D. H., Neely, S. T., and Gorga, M. P. (1998). “On the existence of an age∕threshold∕frequency interaction in distortion product otoacoustic emissions,” J. Acoust. Soc. Am. JASMAN10.1121/1.423339 104, 964–971. - DOI - PubMed
    1. Gorga, M. P., Neely, S. T., Dierking, D. M., Kopun, J., Jolkowski, K., Groenenboom, K., Tan, H., and Stiegemann, B. (2007). “Low-frequency and high-frequency cochlear nonlinearity in humans,” J. Acoust. Soc. Am. JASMAN10.1121/1.2751265 122, 1671–1680. - DOI - PMC - PubMed
    1. He, N. J., and Schmiedt, R. A. (1993). “Fine structure of the 2f1-f2 acoustic distortion product: Changes with primary level,” J. Acoust. Soc. Am. JASMAN10.1121/1.407350 94, 2659–2669. - DOI - PubMed

Publication types