. 2008 Aug;124(2):1207-19.
doi: 10.1121/1.2946715.

A simple-shear rheometer for linear viscoelastic characterization of vocal fold tissues at phonatory frequencies

Affiliations

A simple-shear rheometer for linear viscoelastic characterization of vocal fold tissues at phonatory frequencies

Roger W Chan et al. J Acoust Soc Am. 2008 Aug.

Abstract

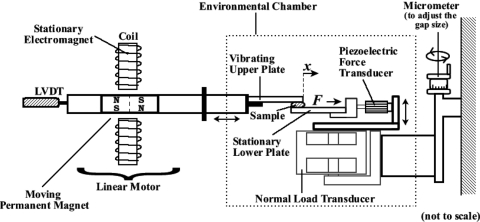
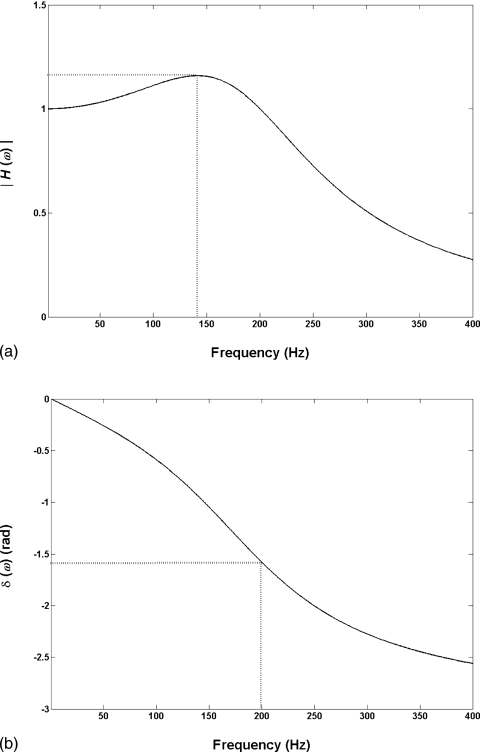
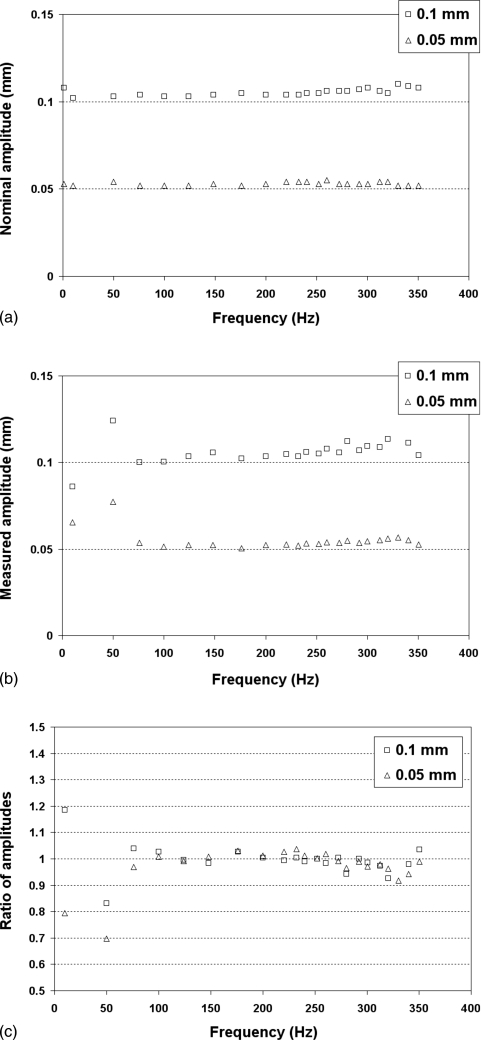
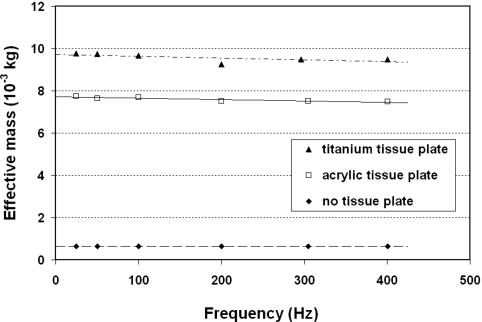
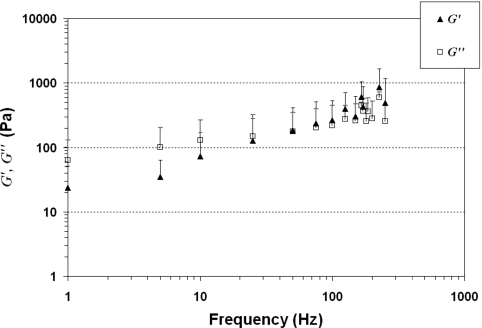
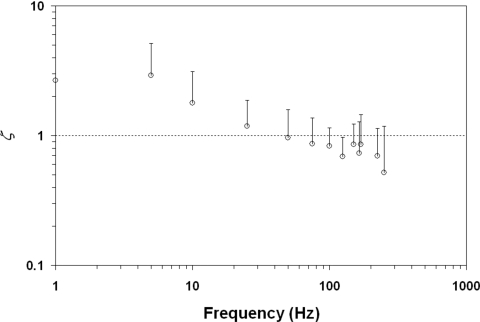
Previous studies reporting the linear viscoelastic shear properties of the human vocal fold cover or mucosa have been based on torsional rheometry, with measurements limited to low audio frequencies, up to around 80 Hz. This paper describes the design and validation of a custom-built, controlled-strain, linear, simple-shear rheometer system capable of direct empirical measurements of viscoelastic shear properties at phonatory frequencies. A tissue specimen was subjected to simple shear between two parallel, rigid acrylic plates, with a linear motor creating a translational sinusoidal displacement of the specimen via the upper plate, and the lower plate transmitting the harmonic shear force resulting from the viscoelastic response of the specimen. The displacement of the specimen was measured by a linear variable differential transformer whereas the shear force was detected by a piezoelectric transducer. The frequency response characteristics of these system components were assessed by vibration experiments with accelerometers. Measurements of the viscoelastic shear moduli (G' and G") of a standard ANSI S2.21 polyurethane material and those of human vocal fold cover specimens were made, along with estimation of the system signal and noise levels. Preliminary results showed that the rheometer can provide valid and reliable rheometric data of vocal fold lamina propria specimens at frequencies of up to around 250 Hz, well into the phonatory range.


Figures

Figure 1
Figure 1
The principle of simple-shear rheometry. A linear, simple-shear deformation is applied to a tissue or material specimen by the upper plate with a small-amplitude translational sinusoidal displacement x. A harmonic shear force F due to the viscoelastic response of the specimen is transmitted to the lower plate, separated from the upper plate by a gap size d. The contact area A between the specimen and the upper plate can be visualized from directly above through the transparent upper plate.
Figure 2
Figure 2
Schematic of the custom-built, controlled-strain, linear, simple-shear rheometer system. A LVDT displacement transducer (Schaevitz MHR 250) is attached to the shaft of the linear motor through an actuator, for estimation of shear strain of the specimen. The resulting shear force (F) at the lower plate is detected by a piezoelectric force transducer (PCB Model 209C12). A normal load transducer measures the compressive force between the specimen and the plates. A micrometer allows one to adjust the gap size (d) between the two plates to accommodate specimens of varying dimensions. Mechanical testing is performed in an environmental chamber at controlled temperature and humidity.
Figure 3
Figure 3
Schematic of the setup for low-frequency calibration of the piezoelectric force transducer. The shaft of the piezoelectric force transducer is attached to the actuator through a tissue clamp. The shaft of a rigidly fixed, calibrated strain gauge (Sensotec Model 31) is attached to the body of the piezoelectric force transducer. Under sinusoidal oscillation at 1.0 Hz, the gain of the piezoelectric force transducer is adjusted to achieve identical dynamic output voltages from both the piezoelectric transducer and the strain gauge.
Figure 4
Figure 4
Schematic of the setup for establishing the frequency response of the piezoelectric force transducer. The body of the piezoelectric force transducer is attached to the actuator, and varying mass (acrylic tissue plate, titanium tissue plate, or no tissue plate) is attached to the shaft of the transducer through an adapter. An accelerometer (PCB Model 353B18) is also attached to the actuator simultaneously for the measurement of acceleration.
Figure 5
Figure 5
(Color online) Typical sinusoidal waveforms of the displacement (x) and shear force (F) signals detected by the rheometer for the following: (a) no specimen, for the estimation of system noise level (frequency=25 Hz); (b) the ANSI S2.21 standard polymer material (frequency=150 Hz); and (c) a vocal fold cover specimen from the 79-year-old male (frequency=100 Hz). The displacement amplitude was 0.01 mm in all cases (dotted line=displacement; solid line=force).
Figure 6
Figure 6
Complex frequency response of the linear rheometer system over a frequency range of 1–400 Hz: (a) magnitude response ∣H(ω)∣ (dimensionless), and (b) phase response δ(ω) in radians. In (a), the damped resonant frequency of the system is observed to be around 142 Hz, where ∣H(ω)∣ is maximum (dotted line). In (b), at the undamped resonant frequency (199 Hz), the phase is at around −π∕2 (dotted line).
Figure 7
Figure 7
(a) Nominal displacement amplitude of the LVDT as a function of frequency, with target amplitudes of 0.05 and 0.1 mm. (b) Measured displacement amplitude of the LVDT as estimated by the accelerometer as a function of frequency. (c) Ratio of the nominal displacement amplitude to the measured amplitude of the LVDT. This ratio indicates the frequency response of the LVDT, which is seen to be flat between around 75 and 275 Hz.
Figure 8
Figure 8
Frequency response of the piezoelectric force transducer as indicated by the effective mass of vibration over a frequency range of 25–400 Hz. Three levels of mass are shown corresponding to a titanium tissue plate, an acrylic tissue plate, and no tissue plate mounted to the adapter (Fig. 4). A flat frequency response can be seen for the piezoelectric transducer over the entire frequency range examined.
Figure 9
Figure 9
(a) Comparisons of the sinusoidal force amplitude (system signal level) for the ANSI S2.21 standard polymer material (n=3) to the force amplitude without any specimen (system noise level from three trials) in the frequency range of 1–300 Hz (means±standard deviations). The system noise level remains much lower than the signal level across all frequencies. (b) Comparisons of the sinusoidal force amplitude (system signal level) for the human vocal fold cover (n=7) to the system noise level (from three trials) in the frequency range of 1–300 Hz (means±standard deviations). The system noise level remains about one standard deviation lower than the signal level at frequencies of up to around 275 Hz.
Figure 10
Figure 10
Elastic shear modulus (G) of the three samples of the ANSI S2.21 standard polymer material as a function of frequency. The Dotted line represents the target elastic modulus of the standard material (3.0 kPa at 25 °C at around 170 Hz).
Figure 11
Figure 11
Elastic shear modulus (G) and viscous shear modulus (G) of three human vocal fold cover specimens as a function of shear strain (i.e., strain sweep; frequency=100 Hz). Based on the data of G, the small-strain linear region of viscoelasticity can be identified with the strain amplitude up to around 3%–7%.
Figure 12
Figure 12
Elastic shear modulus (G) and viscous shear modulus (G) of the human vocal fold cover as a function of frequency. The means and standard deviations (upper error bars) of the seven specimens are shown.
Figure 13
Figure 13
Dynamic viscosity (η) of the human vocal fold cover as a function of frequency. The means and standard deviations (upper error bars) of the seven specimens are shown.
Figure 14
Figure 14
Damping ratio (ζ) of the human vocal fold cover as a function of frequency. The means and standard deviations (upper error bars) of the seven specimens are shown.

Similar articles

Cited by

References

    1. American National Standards Institute, Inc. (1998). “Method for preparation of a standard material for dynamic mechanical measurements,” ANSI S2.21-1998 (Acoustical Society of America, New York, NY: ).
    1. Barnes, H. A., Hutton, J. F., and Walters, K. (1989). An Introduction to Rheology (Elsevier, Amsterdam, The Netherlands: ).
    1. Chan, R. W. (2001). “Estimation of viscoelastic shear properties of vocal fold tissues based on time-temperature superposition,” J. Acoust. Soc. Am. JASMAN10.1121/1.1387094 110, 1548–1561. - DOI - PubMed
    1. Chan, R. W. (2004). “Measurements of vocal fold tissue viscoelasticity: Approaching the male phonatory frequency range,” J. Acoust. Soc. Am. JASMAN10.1121/1.1736272 115, 3161–3170. - DOI - PubMed
    1. Chan, R. W., and Titze, I. R. (1999). “Viscoelastic shear properties of human vocal fold mucosa: Measurement methodology and empirical results,” J. Acoust. Soc. Am. JASMAN10.1121/1.427947 106, 2008–2021. - DOI - PubMed

Publication types

MeSH terms