. 2010 Jan;14(1-2):323-36.
doi: 10.1111/j.1582-4934.2008.00454.x. Epub 2008 Aug 4.

Liposome-based vascular endothelial growth factor-165 transfection with skeletal myoblast for treatment of ischaemic limb disease

Affiliations

Liposome-based vascular endothelial growth factor-165 transfection with skeletal myoblast for treatment of ischaemic limb disease

Lei Ye et al. J Cell Mol Med. 2010 Jan.

Abstract

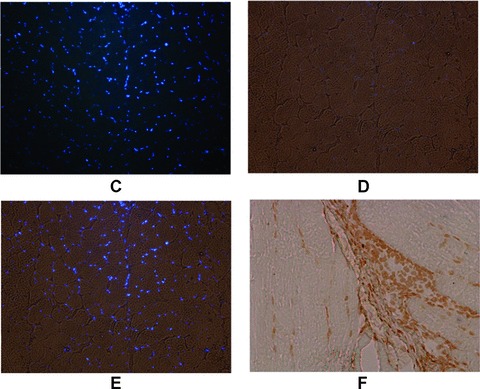
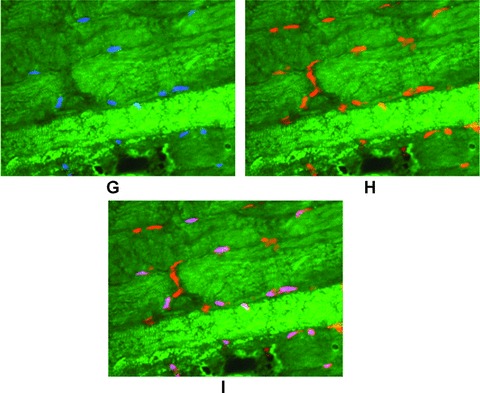
The study aims to use cholesterol (Chol) + DOTAP liposome (CD liposome) based human vascular endothelial growth factor-165 (VEGF(165)) gene transfer into skeletal myoblasts (SkMs) for treatment of acute hind limb ischaemia in a rabbit model. The feasibility and efficacy of CD liposome mediated gene transfer with rabbit SkMs were characterized using plasmid carrying enhanced green fluorescent protein (pEGFP) and assessed by flow cytometry. After optimization, SkMs were transfected with CD lipoplexes carrying plasmid-VEGF(165) (CD-pVEGF(165)) and transplanted into rabbit ischaemic limb. Animals were randomized to receive intramuscular injection of Medium199 (M199; group 1), non-transfected SkM (group 2) or CD-pVEGF(165) transfected SkM (group 3). Flow cytometry revealed that up to 16% rabbit SkMs were successfully transfected with pEGFP. Based on the optimized transfection condition, transfected rabbit SkM expressed VEGF(165) up to day 18 with peak at day 2. SkMs were observed in all cell-transplanted groups, as visualized with 6-diamidino-2-phenylindole and bromodeoxyuridine. Angiographic blood vessel score revealed increased collateral vessel development in group 3 (39.7 +/- 2.0) compared with group 2 (21.6 +/- 1.1%, P < 0.001) and group 1 (16.9 +/- 1.1%, P < 0.001). Immunostaining for CD31 showed significantly increased capillary density in group 3 (14.88 +/- 0.9) compared with group 2 (8.5 +/- 0.49, P < 0.001) and group 1 (5.69 +/- 0.3, P < 0.001). Improved blood flow (ml/min./g) was achieved in animal group 3 (0.173 +/- 0.04) as compared with animal group 2 (0.122 +/- 0.016; P= 0.047) and group 1 (0.062 +/- 0.012; P < 0.001). In conclusion, CD liposome mediated VEGF(165) gene transfer with SkMs effectively induced neovascularization in the ischaemic hind limb and may serve as a safe and new therapeutic modality for the repair of acute ischaemic limb disease.


Figures

Fig 1
Fig 1
(A) Scanning electron micrographs showing CD-DNA lipoplex particle size between 50 and 120 nm when lipoplexes were formed in HEPES buffer with CD:DNA ratio at 9:1 using 3 μg DNA (bar = 500 nm). (B) Size distribution of CD-DNA lipoplexes at various CD:DNA ratios: 6:1, 9:1, 12:1 and 15:1 using 3 μg DNA. (C) Average size and ζ-potential of CD-DNA lipoplex increased from 6:1 to 15:1 using 3 μg DNA. (D) CD liposome encapsulated DNA showed stability against DNase-I for up to 2 hrs as compared with the non-complexed DNA.
Fig 1
Fig 1
(A) Scanning electron micrographs showing CD-DNA lipoplex particle size between 50 and 120 nm when lipoplexes were formed in HEPES buffer with CD:DNA ratio at 9:1 using 3 μg DNA (bar = 500 nm). (B) Size distribution of CD-DNA lipoplexes at various CD:DNA ratios: 6:1, 9:1, 12:1 and 15:1 using 3 μg DNA. (C) Average size and ζ-potential of CD-DNA lipoplex increased from 6:1 to 15:1 using 3 μg DNA. (D) CD liposome encapsulated DNA showed stability against DNase-I for up to 2 hrs as compared with the non-complexed DNA.
Fig 2
Fig 2
(A) Phase contrast photomicrograph of rabbit SkM. (B) Immunostaining of rabbit SkM for desmin expression. (C) Phase contrast photomicrograph of the picture B. (Magnification: A = 40×, B and C = 200×). FACS analysis of isolated rabbit cells for desmin expression. (D) 80% of these cells were positive for desmin expression using (E) non-stained rabbit cells as a control for auto-fluorescence. Optimization of CD-pEGFP transfection with rabbit SkM. (F) Gene transfection efficiency and viability of SkM when CD:pEGFP increased from 6:1 to 15:1 with Chol: DOTAP ratio at 1:4 using 2 μg pEGFP. (G) Gene transfection efficiency and cell viability on trypsinized SkMs when pEGFP was increased from 2 to 5 μg with CD:pEGFP ratio at 9:1.
Fig 2
Fig 2
(A) Phase contrast photomicrograph of rabbit SkM. (B) Immunostaining of rabbit SkM for desmin expression. (C) Phase contrast photomicrograph of the picture B. (Magnification: A = 40×, B and C = 200×). FACS analysis of isolated rabbit cells for desmin expression. (D) 80% of these cells were positive for desmin expression using (E) non-stained rabbit cells as a control for auto-fluorescence. Optimization of CD-pEGFP transfection with rabbit SkM. (F) Gene transfection efficiency and viability of SkM when CD:pEGFP increased from 6:1 to 15:1 with Chol: DOTAP ratio at 1:4 using 2 μg pEGFP. (G) Gene transfection efficiency and cell viability on trypsinized SkMs when pEGFP was increased from 2 to 5 μg with CD:pEGFP ratio at 9:1.
Fig 3
Fig 3
(A) VEGF165 expression from CD-pVEGF165 transfected SkMs. (VEGF = red fluorescence, DAPI = blue fluorescence) (magnification A = 200×). (B) QRT-PCR of CD-pVEGF transfected SkMs at 2, 4, 8 and 18 days after transfection. (C) VEGF165 protein secretion from CD-pVEGF transfected SkMs as a function of time.
Fig 3
Fig 3
(A) VEGF165 expression from CD-pVEGF165 transfected SkMs. (VEGF = red fluorescence, DAPI = blue fluorescence) (magnification A = 200×). (B) QRT-PCR of CD-pVEGF transfected SkMs at 2, 4, 8 and 18 days after transfection. (C) VEGF165 protein secretion from CD-pVEGF transfected SkMs as a function of time.
Fig 4
Fig 4
(A) DAPI labelled rabbit SkMs (blue fluorescence). (B) BrdU-labelled rabbit SkMs as shown brown colour after immunochemical staining. (C) DAPI-labelled rabbit SkMs survived in rabbit skeletal muscle until 6 weeks after transplantation. (D) Picture C under light microscope to show the rabbit skeletal muscle. (E) Overlap of picture C and D. (F) BrdU labelled rabbit SkM in rabbit skeletal muscle at 6 weeks after transplantation. (G) DAPI+ rabbit muscle tissue was immunostained for expression of skeletal myosin heavy chain expression as green fluorescence. (H) The same tissue was counter-stained with propidium iodine to show all the nuclei. (I) Overlap of picture G and H to simultaneously show the co-localization of donor SkM nuclei with host skeletal muscle nuclei. (J) DAPI+ tissue was immunostained for VEGF165 expression at 1 week after CD-pVEGF165 transfected SkM transplantation in rabbit skeletal muscle. (K) The selected area of picture I was magnified to show co-localization of DAPI nuclei (blue) and VEGF165 protein (red). (L) Non-transfected SkM transplanted rabbit tissue was used as negative control (magnification: A, B, J and L = 200×, C, D and E = 40×, F = 100×, G, H, I and K = 400×).
Fig 4
Fig 4
(A) DAPI labelled rabbit SkMs (blue fluorescence). (B) BrdU-labelled rabbit SkMs as shown brown colour after immunochemical staining. (C) DAPI-labelled rabbit SkMs survived in rabbit skeletal muscle until 6 weeks after transplantation. (D) Picture C under light microscope to show the rabbit skeletal muscle. (E) Overlap of picture C and D. (F) BrdU labelled rabbit SkM in rabbit skeletal muscle at 6 weeks after transplantation. (G) DAPI+ rabbit muscle tissue was immunostained for expression of skeletal myosin heavy chain expression as green fluorescence. (H) The same tissue was counter-stained with propidium iodine to show all the nuclei. (I) Overlap of picture G and H to simultaneously show the co-localization of donor SkM nuclei with host skeletal muscle nuclei. (J) DAPI+ tissue was immunostained for VEGF165 expression at 1 week after CD-pVEGF165 transfected SkM transplantation in rabbit skeletal muscle. (K) The selected area of picture I was magnified to show co-localization of DAPI nuclei (blue) and VEGF165 protein (red). (L) Non-transfected SkM transplanted rabbit tissue was used as negative control (magnification: A, B, J and L = 200×, C, D and E = 40×, F = 100×, G, H, I and K = 400×).
Fig 5
Fig 5
Dual fluorescence immunostaining for CD31 (A, D, G) and SMA (B, E, H) at 6 weeks after treatment. Merged images of CD31 and SMA from each group (C, F, I) were used to assess blood vessel maturation index. (Red = CD31; green = SMA) (magnification A–I = 400×). Significantly increased blood vessel density count based on CD31 (J) and SMA (K) was observed in group 3 as compared with groups 1 and 2. (L) Blood vessel maturation index varied insignificantly in all animal groups. (M) Regional blood flow in group 3 was significantly improved as compared with groups 1 and 2 at 6 weeks after cell transplantation.
Fig 5
Fig 5
Dual fluorescence immunostaining for CD31 (A, D, G) and SMA (B, E, H) at 6 weeks after treatment. Merged images of CD31 and SMA from each group (C, F, I) were used to assess blood vessel maturation index. (Red = CD31; green = SMA) (magnification A–I = 400×). Significantly increased blood vessel density count based on CD31 (J) and SMA (K) was observed in group 3 as compared with groups 1 and 2. (L) Blood vessel maturation index varied insignificantly in all animal groups. (M) Regional blood flow in group 3 was significantly improved as compared with groups 1 and 2 at 6 weeks after cell transplantation.
Fig 6
Fig 6
Typical angiographs of rabbit hind limbs at 10 days (baseline) after ligation (A, C, E) and 6 weeks after respective treatment (B, D, F). Higher number of collateral blood vessels were seen in group-3 animals. (G) Angiographic score at 10 days after ligation and 6 weeks after treatment. (The white bar represents the area where M199 or rabbit SkMs injected.)
Fig 6
Fig 6
Typical angiographs of rabbit hind limbs at 10 days (baseline) after ligation (A, C, E) and 6 weeks after respective treatment (B, D, F). Higher number of collateral blood vessels were seen in group-3 animals. (G) Angiographic score at 10 days after ligation and 6 weeks after treatment. (The white bar represents the area where M199 or rabbit SkMs injected.)

Similar articles

Cited by

References

    1. Labs KH, Dormandy JA, Jaeger KA, et al. Transatlantic conference on clinical trial guidelines in peripheral arterial disease: clinical trial methodology. Circulation. 1999;100:e75–81. - PubMed
    1. Dormandy JA, Rutherford RB. Management of peripheral arterial disease (PAD). TASC Working Group. TransAtlantic Inter-Society Concensus (TASC) J Vasc Surg. 2000;31:S1–296. - PubMed
    1. Weitz JI, Byrne J, Clagett GP, et al. Diagnosis and treatment of chronic arterial insufficiency of the lower extremities: a critical review. Circulation. 1996;94:3026–49. - PubMed
    1. Niagara MI, Haider Kh H, Ye Lei, et al. Autologous skeletal myoblasts transduced with a new adenoviral bicistronic vector for treatment of hind limb ischemia. J Vasc Surg. 2004;40:774–85. - PubMed
    1. Bobek V, Taltynov O, Pinterova D, et al. Gene therapy of the ischemic lower limb-Therapeutic angiogenesis. Vasc Pharmacol. 2006;44:395–405. - PubMed

Publication types

MeSH terms

LinkOut - more resources