

Review
doi: 10.1074/jbc.R800052200.
Epub 2008 Aug 4.
Structure and function of photolyase and in vivo enzymology: 50th anniversary
Affiliations
- PMID: 18682397
- PMCID: PMC2583285
- DOI: 10.1074/jbc.R800052200
Item in Clipboard
Review
Structure and function of photolyase and in vivo enzymology: 50th anniversary
J Biol Chem.
.
No abstract available
Figures
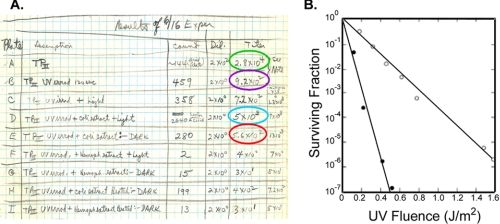
Key experiments in photolyase enzymology. A, historical
experiment that led to the discovery of photolyase by Rupert et al.
(2). This page from C. S.
Rupert's notebook is the record of the experiment done on June 16, 1956 and
shows repair of UV damage to H. influenzae DNA (TP =
transforming principle) by E. coli extract in the presence of blue
light. The table shows the results of a Haemophilus transformation
assay with UV light-irradiated DNA. The titers of transformants are listed in
the last two columns. Row A, unirradiated DNA; row B,
irradiated DNA; row D, irradiated DNA mixed with E. coli
extract and exposed to blue light; row E, same as in row D
but kept in the dark; rows E–I, results from control
experiments (2). B,
flash photolysis. An E. coli strain dependent exclusively on
photolyase for Pyr<>Pyr repair was irradiated with increasing UV doses
and either kept in the dark (•) or exposed to a camera flash (○)
before plating. Cells exposed to a flash after 1.6 J/m2 have
approximately the same survival as cells irradiated with 0.4 J/m2
and kept in dark. Because 1 J/m2 produces 65 Pyr<>Pyr in the
E. coli chromosome, this strain must have at least 65 ×
(1.6–0.4) = 78 photolyase molecules/cell
(4).
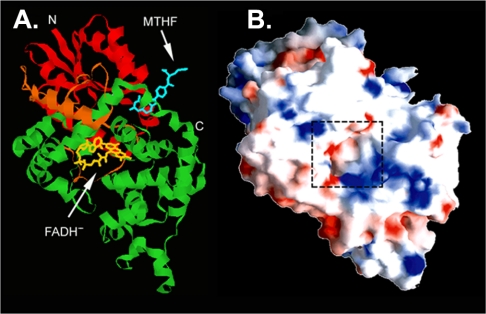
Structure of photolyase. A, ribbon diagram representation.
B, surface potential representation. The dashed box marks
the hole leading to FAD. Positively (blue) and negatively
(red) charged residues are highlighted.
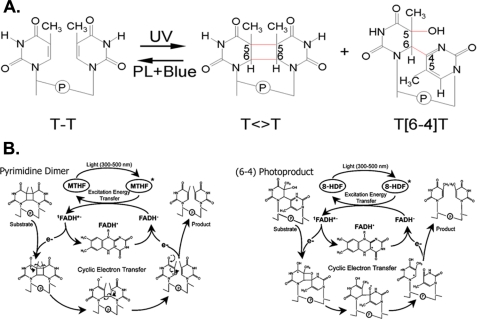
UV photoproducts and reaction mechanisms of photolyases. A,
structures of the two major UV photoproducts. PL, photolyase.
B, reaction mechanisms of photolyases. Left, E. coli CPD
photolyase; right, D. melanogaster (6-4) photolyase. For clarity, the
two critical His residues essential for catalysis by stabilizing the putative
oxetane intermediate by the general acid-base mechanism
(33,
36) are not shown.
References
Publication types
MeSH terms
Substances
Grants and funding
LinkOut - more resources
Full Text Sources
Other Literature Sources
Molecular Biology Databases
