. 2008 Oct 24;283(43):29513-21.
doi: 10.1074/jbc.M803681200. Epub 2008 Aug 4.

MSX2 stimulates chondrocyte maturation by controlling Ihh expression

Affiliations

MSX2 stimulates chondrocyte maturation by controlling Ihh expression

Katsuhiko Amano et al. J Biol Chem. .

Abstract

Several studies indicated that a homeobox gene, Msx2, is implicated in regulation of skeletal development by controlling enchondral ossification as well as membranous ossification. However, the molecular basis by which Msx2 conducts chondrogenesis is currently unclear. In this study, we examined the role of Msx2 in chondrocyte differentiation using mouse primary chondrocytes and embryonic metatarsal explants. Treatment with BMP2 up-regulated the expression of Msx2 mRNA along with chondrocyte differentiation in murine primary chondrocytes. Overexpression of wild-type Msx2 stimulated calcification of primary chondrocytes in the presence of BMP2. We also found that constitutively active Msx2 (caMsx2) enhanced BMP2-dependent calcification more efficiently than wild-type Msx2. Consistently, caMsx2 overexpression up-regulated the expression of alkaline phosphatase and collagen type X induced by BMP2. Furthermore, organ culture experiments using mouse embryonic metatarsals indicated that caMsx2 clearly stimulated the maturation of chondrocytes into the prehypertrophic and hypertrophic stages in the presence of BMP2. In contrast, knockdown of Msx2 inhibited maturation of primary chondrocytes. The stimulatory effect of Msx2 on chondrocyte maturation was enhanced by overexpression of Smad1 and Smad4 but inhibited by Smad6, an inhibitory Smad for BMP2 signaling. These data suggest that Msx2 requires BMP2/Smad signaling for its chondrogenic action. In addition, caMsx2 overexpression induced Ihh (Indian hedgehog) expression in mouse primary chondrocytes. Importantly, treatment with cyclopamine, a specific inhibitor for hedgehogs, blocked Msx2-induced chondrogenesis. Collectively, our results indicated that Msx2 promotes the maturation of chondrocytes, at least in part, through up-regulating Ihh expression.


Figures

FIGURE 1.
FIGURE 1.
Induction of Msx2 expression by BMP2 in chondrocyte differentiation. A, mouse primary chondrocytes were cultured with or without BMP2 (150 ng/ml) for 4 days and photographed under a microscope. B, mouse primary chondrocytes were cultured with or without BMP2 (150 ng/ml) for 4 days. Total RNA isolated from the cells was determined by RT-PCR analysis for Col2α1 (top), Col10α1 (middle), or β-actin (bottom). C, mouse primary chondrocytes were cultured with or without BMP2 (150 ng/ml) for 4 days. Total RNA isolated from the cells was determined by real time RT-PCR analysis for Col2α1, Col10α1, Col1α1, and Col1α2. Expression level of each sample was normalized by the expression of β-actin. Data represent mean ± S.D. (n = 3). p values were determined by Student's t test. *, p < 0.05 (versus control); **, p < 0.01 (versus control). D, mouse primary chondrocytes were cultured with BMP2 (150 ng/ml) for 7 days and immunostained with anti-Col10 antibody (top). Bottom, 4′,6-diamidino-2-phenylindole (DAPI) staining of the cells. E, primary chondrocytes were cultured with or without BMP2 (150 ng/ml) for 4 or 8 days and then determined by Alcian blue staining (top) or alizarin red staining (bottom), respectively. F, mouse primary chondrocytes were cultured with or without BMP2 (150 ng/ml) for 4 days. Total RNA isolated from the cells was determined by real time PCR for Msx2. Data represent mean ± S.D. (n = 3). **, p < 0.01 (versus control) as determined by Student's t test.
FIGURE 2.
FIGURE 2.
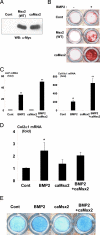
Stimulation of maturation of chondrocytes by Msx2. A, mouse primary chondrocytes were infected with adenovirus carrying wild type (WT) Msx2 or caMsx2 and cultured for 4 days. The lysates of the cells were determined by immunoblotting with anti-Myc antibody. B and C, mouse primary chondrocytes were infected with control (Cont) adenovirus or adenovirus carrying wild type Msx2 or caMsx2, cultured with or without BMP2 (100 ng/ml) for 7 days, and determined by alizarin red staining (B) and real time PCR using Taqman probe of ALP and Col10α1 (C). Data represent mean ± S.D. (n = 3). p values were determined by one-way ANOVA. #, p < 0.01 (versus control); **, p < 0.01 (versus BMP2 group). D and E, mouse primary chondrocytes were infected with control or caMsx2 adenovirus, cultured with or without BMP2 (100 ng/ml) for 4 days, and determined by real time PCR analysis for Col2α1 (D) and Alcian blue staining (E). Data represent mean ± S.D. (n = 3). *, p < 0.05 (versus control) as determined by one-way ANOVA. There is no significant difference between the BMP2 and BMP2 + caMsx2 groups. WB, Western blot.
FIGURE 3.
FIGURE 3.
Requirement of BMP2/Smad signaling for chondrogenic action of Msx2. A, mouse primary chondrocytes infected with control (Cont) adenovirus or adenoviruses carrying caMsx2 and/or Smad6, cultured with or without BMP2 (100 ng/ml) for 7 days, and determined by alizarin red staining. B, mouse primary chondrocytes infected with control adenovirus or adenoviruses carrying caMsx2 and/or Smad1 and Smad4, cultured in the presence of BMP2 (75 ng/ml) for 7 days, and determined by alizarin red staining. C, C3H10T1/2 cells were infected with control or Myc-Smad1 adenovirus and then lysed. The cell lysates were incubated with or without recombinant His-tagged Msx2 protein immobilized with TALON beads and precipitated (Ppt) with the beads. The associated proteins with the beads were determined by immunoblotting with anti-Myc antibody.
FIGURE 4.
FIGURE 4.
Stimulation of chondrocyte maturation in mouse metatarsal by Msx2. A, mouse metatarsal explants isolated from a day 15.5 mice embryo were infected with control (Cont) or caMsx2 adenovirus at a multiplicity of infection of 80, cultured with or without BMP2 (250 ng/ml) for 7 days, and observed under a microscope. Bar, 500 μm. B, schematic diagram of morphometric analyses of mouse metatarsal explants. We classified uncalcified cartilaginous primordial or calcified chondrocyte marking the developing light or dark zone of chondrocytes, respectively. C, mouse metatarsal explants were cultured as described in A. The maximal longitudinal length and width of the explants were measured. Data represent mean ± S.D. (n = 7). **, p < 0.01 (versus control, BMP2, and caMsx2) as determined by one-way ANOVA. D, cultured metatarsal explants of C were subjected to hematoxylin/eosin staining. Magnification was as follows: ×50 (top) and ×200 (bottom). E, mouse metatarsal explants were cultured as described in A. The histological sections were immunostained with anti-PTH/PTHrP receptor antibody. Each bar shows the area expressing PTH/PTHrP receptor. F-H, mouse metatarsal explants were cultured as described in A and subjected to ALP staining (F) and PCNA staining (G). PCNA-positive chondrocytes were calculated (H). Data represent mean ± S.D. (n = 3). There is no significant difference among each group.
FIGURE 5.
FIGURE 5.
Up-regulation of Ihh expression by Msx2. A, primary chondrocytes were infected with control (Cont) or caMsx2 adenovirus, cultured with or without BMP2 (100 ng/ml) for 4 days. Total RNA isolated from the cells was determined by real time PCR analysis for Ihh. Data represent mean ± S.D. (n = 3). p values were determined by one-way ANOVA. #, p < 0.01 (versus control); **, p < 0.01 (versus BMP2). B and C, mouse primary chondrocytes were infected with control or caMsx2 adenovirus, cultured with BMP2 (100 ng/ml) and cyclopamine (Cy;5 μm) as indicated for 7 days, and determined by alizarin red staining (B). C, alizarin red-positive area measured by ImagePro software. Data represent mean ± S.D. (n = 3). p values were determined by one-way ANOVA. **, p < 0.01 (versus BMP2); #, p < 0.01 (versus BMP2 + caMsx2). D, mouse primary chondrocytes were infected with control or Ihh adenovirus, cultured for 7 days, and determined by alizarin red staining (top). Expression of Ihh mRNA was confirmed by RT-PCR analysis (middle). β-Actin expression was also determined as control (bottom). E, mouse primary chondrocytes infected with control or Ihh adenovirus were cultured with or without cyclopamine (5 μm) for 7 days and determined by alizarin red staining. F and G, mouse primary chondrocytes infected with control or Ihh adenovirus were cultured for 4 days, and total RNA isolated from the cells was analyzed by real time PCR for ALP (F) and Runx2 (G). Data represent mean ± S.D. (n = 3). **, p < 0.01 (versus control) as determined by Student's t test. H, mouse primary chondrocytes infected with control or Ihh adenovirus were cultured for 4 days in the presence or absence of cyclopamine (5 μm), and total RNA isolated from the cells was analyzed by real time PCR for Col10α1. Data represent mean ± S.D. (n = 3). p values were determined by one-way ANOVA. #, p < 0.01 (versus control); **, p < 0.01 (versus Ihh). I, mouse primary chondrocyte-infected control or Ihh adenovirus were cultured in the presence or absence of cyclopamine (5 μm) for a week, and then cell numbers were counted. p values were determined by one-way ANOVA. *, p < 0.01 (versus control); #, p < 0.01 (versus Ihh). J, mouse primary chondrocyte-infected control or Ihh adenovirus were cultured in the presence or absence of cyclopamine (5 μm) for 4 days and then subjected to Alcian blue staining.
FIGURE 6.
FIGURE 6.
Suppression of caMsx2-stimulated calcification of mouse primary chondrocytes by dominant negative Gli2. Mouse primary chondrocytes infected with control (Cont) or caMsx2 adenovirus and/or a dominant negative Gli2 (DN-Gli2) adenovirus were cultured for 7 days in the presence or absence of BMP2 (150 μm) and subjected to alizarin red staining (A). Alizarin red-positive area was measured by ImagePro software (B). Data represent mean ± S.D. (n = 3). p values were determined by one way ANOVA. #, p < 0.01 (versus control); *, p < 0.01 (versus BMP2); ##, p < 0.01 (versus BMP2); **, p < 0.01 (versus BMP2 + caMsx2).
FIGURE 7.
FIGURE 7.
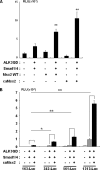
Up-regulation of Ihh gene promoter activity by Msx2. A, Ihh gene promoter luciferase (-1313) and thymidine kinase-Renilla reporter constructs were transfected into C3H10T1/2 cells. After 1 day, the cells were infected with adenoviruses, as indicated. 2 days after the end of culture, cells were lysed, and the luciferase activity was measured and normalized by determining Renilla luciferase activity as described under “Experimental Procedures.” Data represent mean ± S.D. (n = 3). **, p < 0.01 (versus ALK3QD + Smad1/4) as determined by one-way ANOVA. B, series of Ihh gene promoter constructs were transfected into C3H10T1/2 cells together with the thymidine kinase-Renilla reporter construct. The cells were infected with adenoviruses as indicated. At the end of culture, cells were lysed, and the luciferase activity was measured and normalized by determining Renilla luciferase activity as described under “Experimental Procedures.” Data represent mean ± S.D. (n = 4). *, p < 0.01 (versus 163-Luc); **, p < 0.05 (versus 163-Luc) as determined by two-way ANOVA (significant induction by caMsx2).
FIGURE 8.
FIGURE 8.
Requirement of Msx2 for chondrocyte maturation. Mouse primary chondrocytes were transfected with siRNA specific for Msx2 (siMsx2-1 or siMsx2-2) or control siRNA and then incubated for 3 days in the presence or absence of BMP2 (150 ng/ml). The total RNA was isolated from the cells and subjected to real time PCR analysis for Msx2 (A), Col10α1 (B), ALP (C), or Ihh (D). Expression levels of each sample were normalized with expression level of β-actin mRNA. Data represent mean ± S.D. (n = 3). *, p < 0.05 (versus BMP2); **, p < 0.01 (versus BMP2) as determined by one-way ANOVA.
FIGURE 9.
FIGURE 9.
Inhibition of chondrocyte differentiation at early stage by Msx2. A and B, C3H10T1/2 cells infected with control (Cont) or caMsx2 adenovirus were cultured with or without BMP2 (50 ng/ml) for 7 days and subjected to immunoblotting with anti-Col2 (A, top) or β-actin antibody (A, bottom) and Alcian blue staining (B). C, C3H10T1/2 were infected with control (Cont) or caMsx2 adenovirus and cultured with or without BMP2 (50 ng/ml) for 4 days. The 3-(4,5-dimethylthiazol-2-yl)-2,5-diphenyltetrazolium bromide assay was performed to evaluate cell proliferation. Data represent mean ± S.D. (n = 4). p values were determined by one-way ANOVA. #, p < 0.01 (control); **, p < 0.01 (versus control, BMP2). D, mouse limb bud cells were infected with control or caMsx2 adenovirus and then subjected to micromass culture in the presence or absence of BMP2 (150 ng/ml). After 4 days, the cells were stained with Alcian blue.

References

    1. Shum, L., and Nuckolls, G. (2002) Arthritis Res. 4 94-106 - PMC - PubMed
    1. Lai, L. P., and Mitchell, J. (2005) J. Cell Biochem. 96 1163-1173 - PubMed
    1. Provot, S., and Schipani, E. (2005) Biochem. Biophys. Res. Commun. 328 658-665 - PubMed
    1. Kobayashi, T., and Kronenberg, H. (2005) Endocrinology 146 1012-1017 - PubMed
    1. Ryoo, H. M., Lee, M. H., and Kim, Y. J. (2006) Gene (Amst.) 366 51-57 - PubMed

Publication types