. 2008:4:214.
doi: 10.1038/msb.2008.50. Epub 2008 Aug 5.

Metabolic profiling of the human response to a glucose challenge reveals distinct axes of insulin sensitivity

Affiliations

Metabolic profiling of the human response to a glucose challenge reveals distinct axes of insulin sensitivity

Oded Shaham et al. Mol Syst Biol. 2008.

Abstract

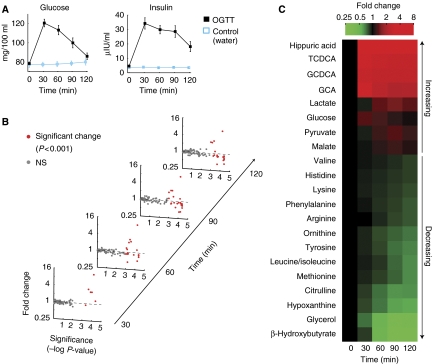
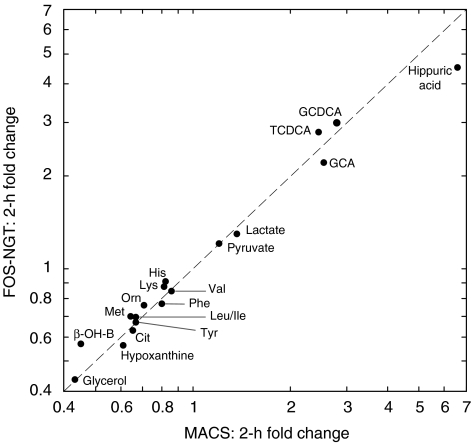
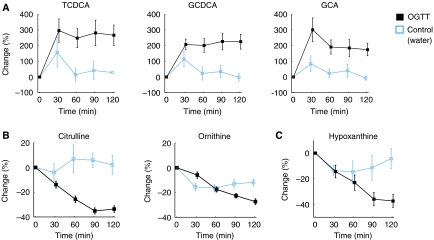
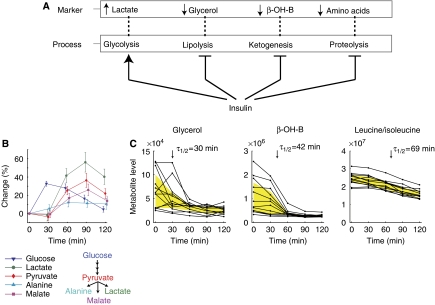
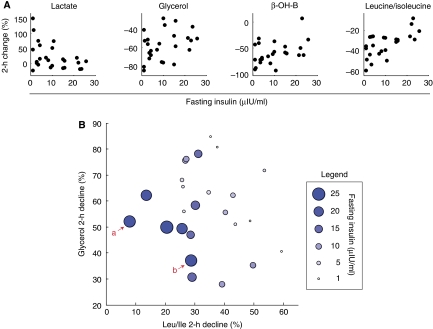
Glucose ingestion after an overnight fast triggers an insulin-dependent, homeostatic program that is altered in diabetes. The full spectrum of biochemical changes associated with this transition is currently unknown. We have developed a mass spectrometry-based strategy to simultaneously measure 191 metabolites following glucose ingestion. In two groups of healthy individuals (n=22 and 25), 18 plasma metabolites changed reproducibly, including bile acids, urea cycle intermediates, and purine degradation products, none of which were previously linked to glucose homeostasis. The metabolite dynamics also revealed insulin's known actions along four key axes--proteolysis, lipolysis, ketogenesis, and glycolysis--reflecting a switch from catabolism to anabolism. In pre-diabetics (n=25), we observed a blunted response in all four axes that correlated with insulin resistance. Multivariate analysis revealed that declines in glycerol and leucine/isoleucine (markers of lipolysis and proteolysis, respectively) jointly provide the strongest predictor of insulin sensitivity. This observation indicates that some humans are selectively resistant to insulin's suppression of proteolysis, whereas others, to insulin's suppression of lipolysis. Our findings lay the groundwork for using metabolic profiling to define an individual's 'insulin response profile', which could have value in predicting diabetes, its complications, and in guiding therapy.


Figures

Figure 1
Figure 1
Temporal response to an oral glucose challenge in individuals with normal glucose tolerance (MACS). (A) Kinetics of blood glucose and insulin in response to glucose ingestion (mean±s.e.m.). (B) Magnitude and significance of metabolite change over time. Dots represent the 97 metabolites detected in plasma. Change is with respect to the fasting metabolite levels. Significant (P<0.001) changes are colored red. (C) Significant metabolite changes. In total, 21 metabolites changed significantly (P<0.001) when compared to their fasting levels and showed a significantly (P<0.05) distinct response compared to control (water ingestion). Color intensity reflects the median fold change compared to the fasting levels. Metabolites are ordered according to the magnitude of change.
Figure 2
Figure 2
Validation of metabolite changes at the 2-h time point. In total, 18 out of the 20 metabolites that changed significantly in MACS (Figure 1C) replicated (P<0.05) in FOS-NGT. Dots correspond to the median fold change of metabolites at the 2-h time point. Abbreviations: TCDCA, taurochenodeoxycholic acid; GCDCA, glycochenodeoxycholic acid; GCA, glycocholic acid, Orn: ornithine, Cit: citrulline, β-OH-B: β-hydroxybutyrate.
Figure 3
Figure 3
Metabolic responses not previously linked to glucose homeostasis. Kinetic patterns in the MACS group are shown (mean±s.e.m.). (A) Bile acids. Abbreviations: TCDCA, taurochenodeoxycholic acid; GCDCA, glycochenodeoxycholic acid; GCA, glycocholic acid. (B) Citrulline and ornithine, urea cycle intermediates. (C) Hypoxanthine, a product of purine nucleotide degradation.
Figure 4
Figure 4
Metabolites reflecting four axes of insulin action. (A) Four axes of insulin action and their associated metabolic markers. (B) The kinetics of glucose and pyruvate derivatives (MACS, mean±s.e.m.). (C) The kinetics of insulin's suppression of catabolism. Each line corresponds to 1 of 12 individual MACS subjects. τ1/2: time to half-maximal decrease (median of all subjects). The inter-quartile range of metabolite levels is shaded in yellow. Abbreviations: β-OH-B, β-hydroxybutyrate.
Figure 5
Figure 5
Correlation between fasting insulin and 2-h metabolite changes in individuals with impaired glucose tolerance (FOS-IGT). (A) 2-h changes in markers of insulin action are correlated with fasting insulin concentration. Each dot corresponds to an individual. (B) A bivariate model explaining fasting insulin using the 2-h decline of Leu/Ile and glycerol. Each circle represents an individual, and the circle size is proportionate to fasting insulin levels. aA representative individual exhibiting a blunted decline in Leu/Ile (resistant to proteolysis suppression). bA representative individual exhibiting a blunted decline in glycerol (resistant to lipolysis suppression).

References

    1. American Diabetes Association (2007) Diagnosis and classification of diabetes mellitus. Diabetes Care 30 (Supplement 1): S42–S47 - PubMed
    1. Angelin B, Bjorkhem I, Einarsson K, Ewerth S (1982) Hepatic uptake of bile acids in man. Fasting and postprandial concentrations of individual bile acids in portal venous and systemic blood serum. J Clin Invest 70: 724–731 - PMC - PubMed
    1. Arnlov J, Pencina MJ, Nam BH, Meigs JB, Fox CS, Levy D, D'Agostino RB, Vasan RS (2005) Relations of insulin sensitivity to longitudinal blood pressure tracking: variations with baseline age, body mass index, and blood pressure. Circulation 112: 1719–1727 - PubMed
    1. Brauer MJ, Yuan J, Bennett BD, Lu W, Kimball E, Botstein D, Rabinowitz JD (2006) Conservation of the metabolomic response to starvation across two divergent microbes. Proc Natl Acad Sci USA 103: 19302–19307 - PMC - PubMed
    1. Brown MS, Goldstein JL (2008) Selective versus total insulin resistance: a pathogenic paradox. Cell Metab 7: 95–96 - PubMed

Publication types

MeSH terms