. 2008 Aug 4:14:1414-28.

Transcriptional regulatory network analysis during epithelial-mesenchymal transformation of retinal pigment epithelium

Affiliations

Transcriptional regulatory network analysis during epithelial-mesenchymal transformation of retinal pigment epithelium

Craig H Pratt et al. Mol Vis. .

Abstract

Purpose: Phenotypic transformation of retinal pigment epithelial (RPE) cells contributes to the onset and progression of ocular proliferative disorders such as proliferative vitreoretinopathy (PVR). The formation of epiretinal membranes in PVR may involve an epithelial-mesenchymal transformation (EMT) of RPE cells as part of an aberrant wound healing response. While the underlying mechanism remains unclear, this likely involves changes in RPE cell gene expression under the control of specific transcription factors (TFs). Thus, the purpose of the present study was to identify TFs that may play a role in this process.

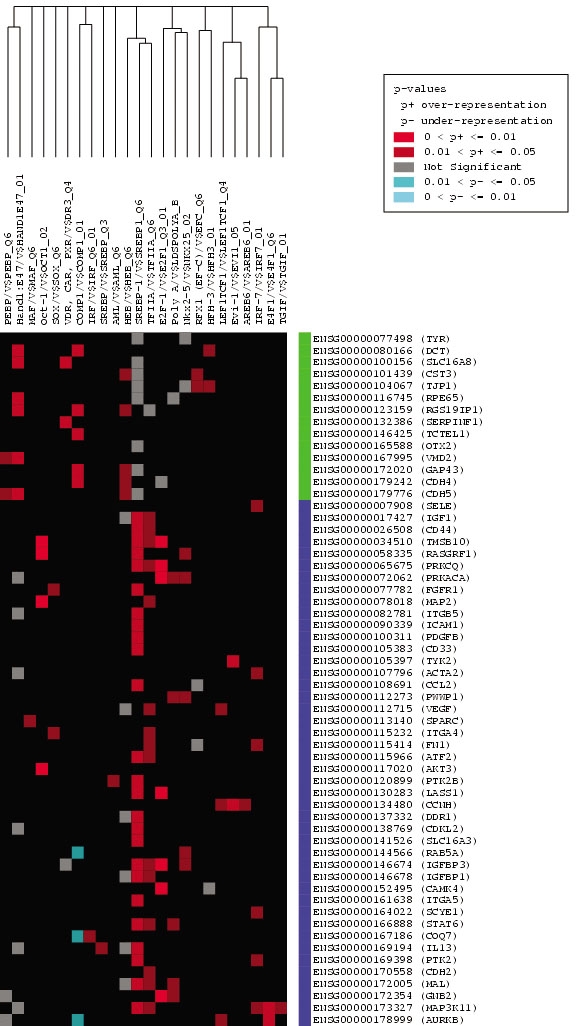
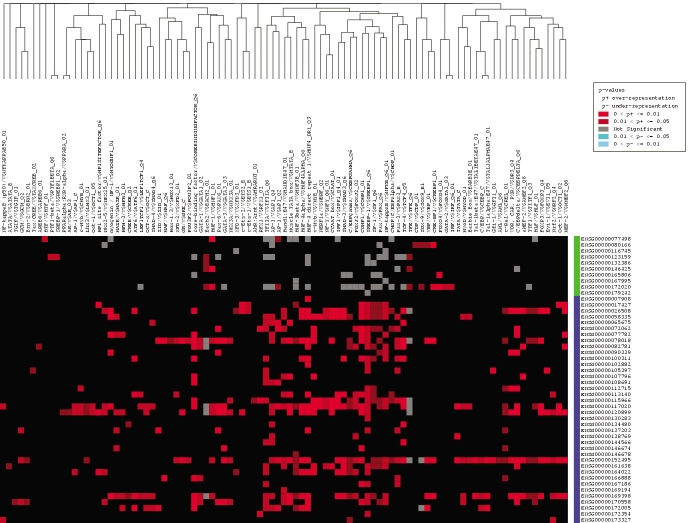
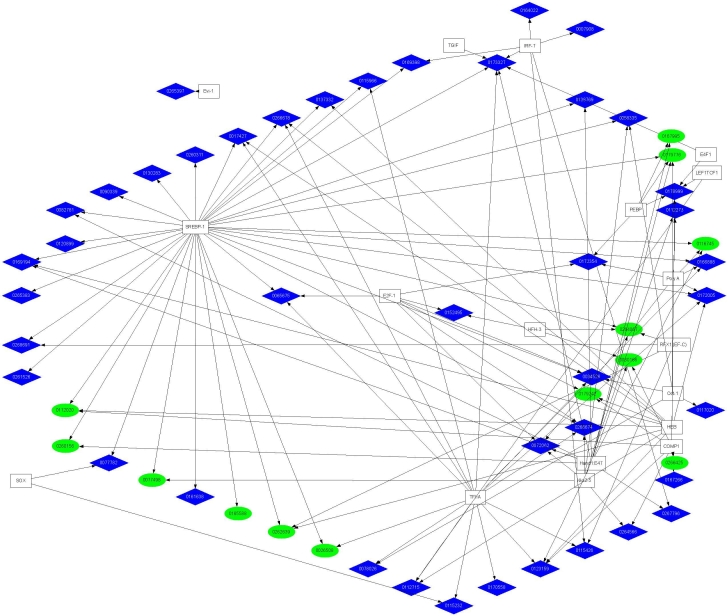
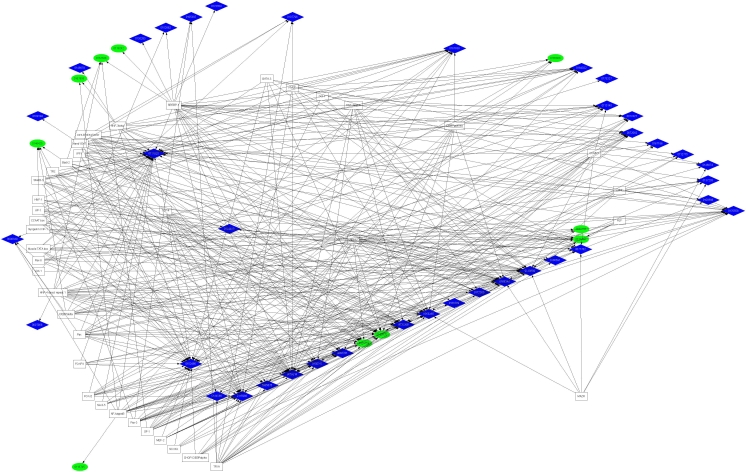
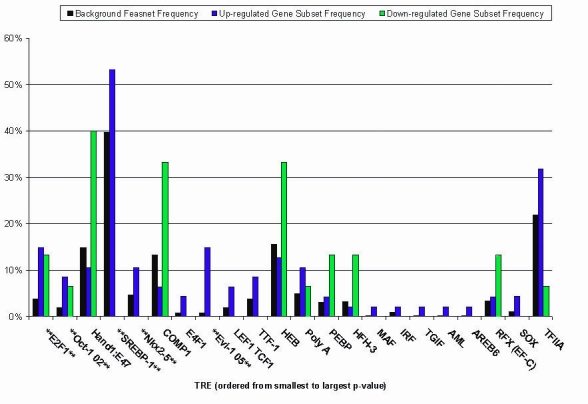
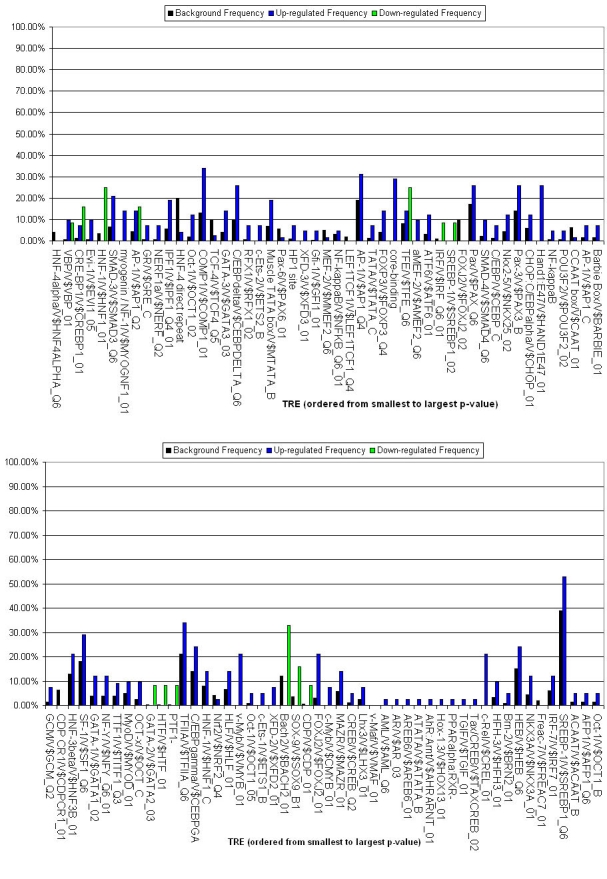
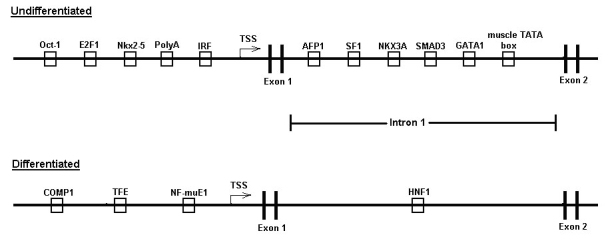
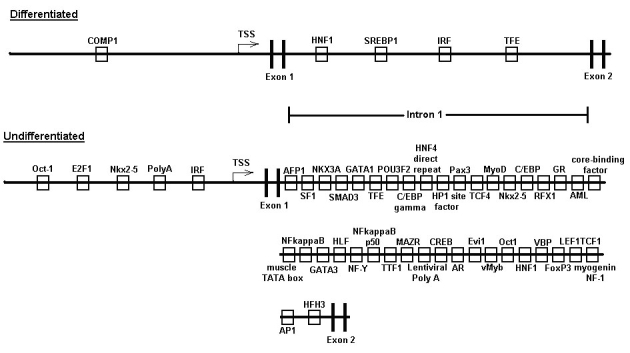
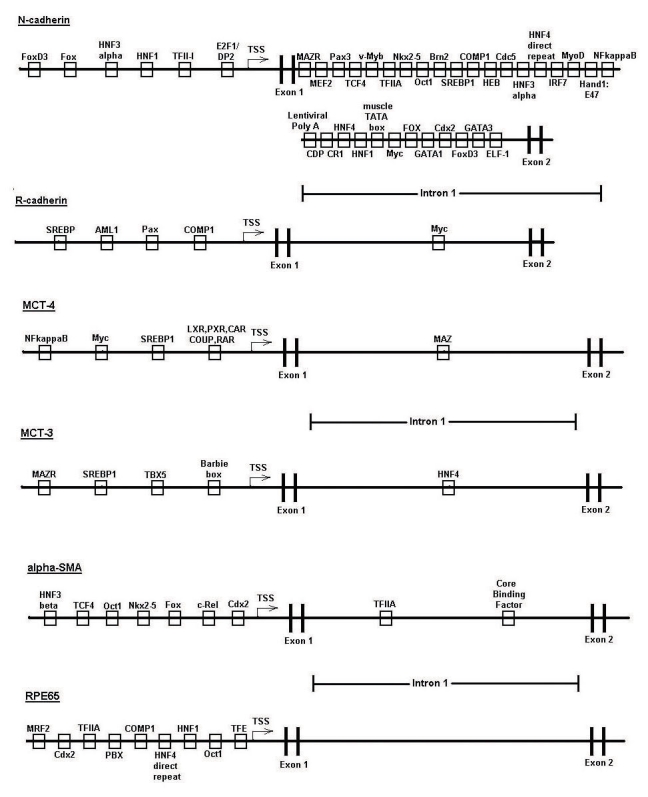
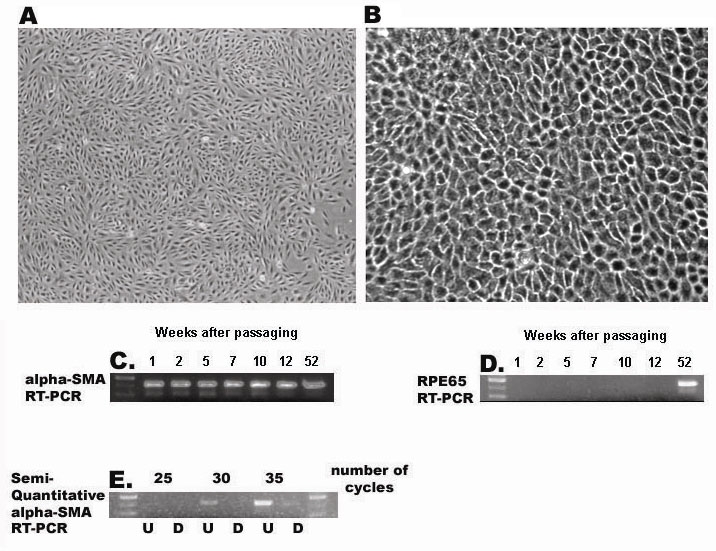
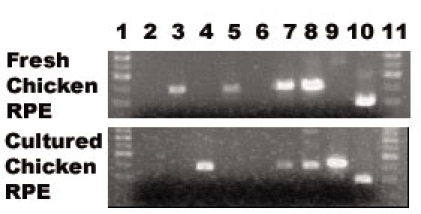
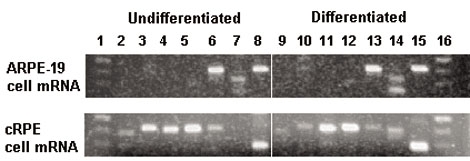
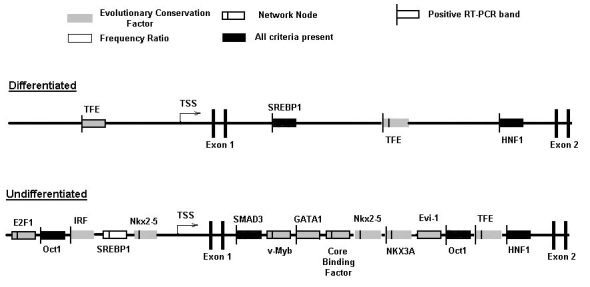
Methods: Regulatory regions of genes that are differentially regulated during phenotypic transformation of ARPE-19 cells, a human RPE cell line, were subjected to computational analysis using the promoter analysis and interaction network toolset (PAINT). The PAINT analysis was used to identify transcription response elements (TREs) statistically overrepresented in the promoter and first intron regions of two reciprocally regulated RPE gene clusters, across four species including the human genome. These TREs were then used to construct transcriptional regulatory network models of the two RPE gene clusters. The validity of these models was then tested using RT-PCR to detect differential expression of the corresponding TF mRNAs during RPE differentiation in both undifferentiated and differentiated ARPE-19 and primary chicken RPE cell cultures.

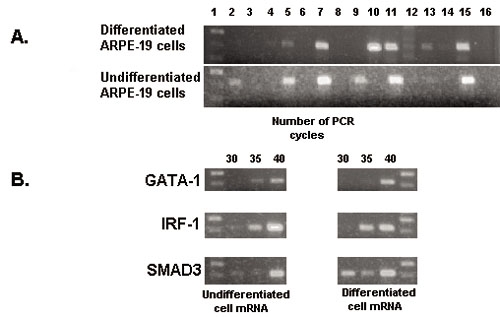
Results: The computational analysis resulted in the successful identification of specific transcription response elements (TREs) and their cognate TFs that are candidates for serving as nodes in a transcriptional regulatory network regulating EMT in RPE cells. The models predicted TFs whose differential expression during RPE EMT was successfully verified by reverse transcriptase polymerase chain reaction (RT-PCR) analysis, including Oct-1, hepatocyte nuclear factor 1 (HNF-1), similar to mothers against decapentaplegic 3 (SMAD3), transcription factor E (TFE), core binding factor, erythroid transcription factor-1 (GATA-1), interferon regulatory factor-1 (IRF), natural killer homeobox 3A (NKX3A), Sterol regulatory element binding protein-1 (SREBP-1), and lymphocyte enhancer factor-1 (LEF-1).

Conclusions: These studies successfully applied computational modeling and biochemical verification to identify biologically relevant transcription factors that are likely to regulate RPE cell phenotype and pathological changes in RPE in response to diseases or trauma. These TFs may provide potential therapeutic targets for the prevention and treatment of ocular proliferative disorders such as PVR.


Figures

Figure 1
Figure 1
Candidate interaction matrix for statistically enriched transcription response elements from promoter analysis and interaction network toolset analysis of human gene promoters. The retinal pigment epithelium (RPE) gene set was analyzed by promoter analysis and interaction network toolset (PAINT) and a graphic candidate interaction matrix (CIM) was generated as described in Methods. The y-axis lists the Ensembl Gene identifiers for each gene and the x-axis lists the TRANSFAC identifiers for each transcription response element (TRE) found at least once in the promoter region of one or more genes. Genes listed along the y-axis are divided into two clusters that are either upregulated (blue) or down-regulated (green) during epithelial-mesenchymal transformation (EMT) of RPE cells. TREs listed along the x-axis are clustered according to related occurrence pattern calculated using Jaccard's coefficient. The elements within the matrix are color-coded based on the p-value of each TRE found in the regulatory regions of the genes. A red dot represents a TRE that is statistically significant and therefore over-represented in our gene set, while a blue dot signifies an under-represented TRE and a gray dot stands for a TRE with no statistical significance in our gene list. This figure represents the subset of enriched TREs for the human genome; the full CIMs for human and other genomes analyzed are shown in Appendix 4, Appendix 5, Appendix 12, and Appendix13.
Figure 2
Figure 2
Candidate interaction matrix for statistically enriched transcription response elements from promoter analysis and interaction network toolset analysis of human gene first introns. The retinal pigment epithelium (RPE) gene set was analyzed by promoter analysis and interaction network toolset (PAINT) and a graphic candidate interaction matrix (CIM) was generated as described in Methods. The y-axis lists the Ensembl Gene identifiers for each gene and the x-axis lists the TRANSFAC identifiers for each transcription response element (TRE) found at least once in the first intron region. Genes listed along the y-axis are divided into two clusters that are either upregulated (blue) or down-regulated (green) during EMT of RPE cells. TREs listed along the x-axis are clustered according to related occurrence pattern calculated using Jaccard's coefficient. The elements within the matrix are color-coded based on the p-value of each TRE found in the regulatory regions of the genes. A red dot represents a TRE that is statistically significant and therefore over-represented in our gene set, while a blue dot signifies an under-represented TRE and a gray dot stands for a TRE with no statistical significance in our gene list. This figure represents the subset of enriched TREs for the human genome; the full CIMs for human and other genomes analyzed are shown in Appendix 14 through Appendix 17.
Figure 3
Figure 3
Transcriptional regulatory network diagram for transcription response element associated with human promoter regions. The graphical representation was derived using GraphViz as described in Methods. The ellipses and diamonds represent individual genes divided into upregulated (blue) and down-regulated (green) clusters. The boxes represent TREs, with arrows indicating gene-TRE associations. Corresponding network diagrams for mouse, rat and chick promoter regions are shown in Appendix 18 through Appendix 20.
Figure 4
Figure 4
Transcriptional regulatory network diagram for transcription response element associated with human first intron regions. The graphical representation was derived using GraphViz as described in Methods. The ellipses and diamonds represent individual genes divided into upregulated (blue) and down-regulated (green) clusters. The boxes represent TREs, with arrows indicating gene-TRE associations. Corresponding network diagrams for mouse, rat and chick first intron regions are shown in Appendix 21 through Appendix 23.
Figure 5
Figure 5
Frequency analysis of transcription response element representation in human promoter regions. Frequency of occurrence of each transcription response element (TRE) in the human gene promoter regions was determined from the promoter analysis and interaction network toolset (PAINT) analysis as described in Methods. The y-axis indicates the frequency of each TRE among the upregulated (blue) or down-regulated (green) gene clusters as well as among the full background gene set (black). The x-axis indicates the over-represented TREs, ordered by increasing p-value. Corresponding frequency analyses for mouse, rat and chick promoter regions are shown in Appendix 24 through Appendix 26.
Figure 6
Figure 6
Frequency analysis of transcription response element representation in human first intron regions. Frequency of occurrence of each transcription response element (TRE) in the human gene first intron regions was determined from the PAINT analysis as described in Methods. The y-axis indicates the frequency of each TRE among the upregulated (blue) or down-regulated (green) gene clusters as well as among the full background gene set (black). The x-axis indicates the over-represented TREs, ordered by increasing p-value. Corresponding frequency analyses for mouse, rat and chick first intron regions are shown in Appendix 27 through Appendix 29.
Figure 7
Figure 7
Archetypal cross-species gene regulatory region models of undifferentiated and differentiated gene clusters. These models incorporate transcription response element (TREs) that were found to be over-represented in results of both the human and chicken, as well as either the mouse or rat, promoter analysis and interaction network toolset (PAINT) analysis. TSS represents transcriptional start site.
Figure 8
Figure 8
Human gene regulatory region models of undifferentiated and differentiated gene clusters. These models incorporate transcription response elements (TREs) that were found to be over-represented in results of the human, and either the chicken, mouse or rat, promoter analysis and interaction network toolset (PAINT) analysis. TSS represents transcriptional start site.
Figure 9
Figure 9
Gene regulatory region models for specific reciprocally-regulated gene pairs. Models for the paired genes that are reciprocally regulated during EMT of RPE cells models including N- and R-cadherin (A), α-SMA and RPE-65 (B), and MCT-3 and −4 (C). Models were constructed by including only those TREs that are over-represented in both the human and chicken, as well as either the mouse or rat, PAINT analysis.
Figure 10
Figure 10
Reverse transcriptase polymerase chain reaction analysis of markers during retinal pigment epithelium cell differentiation. mRNA was isolated from undifferentiated (A) or differentiated (B) ARPE-19 cells and subjected to reverse transcriptase polymerase chain reaction amplification to detect SMA (C) or RPE65 (D) as described in Methods. Phase-contrast micrographs represent undifferentiated (A) or differentiated (B) ARPE-19 cells after one week (A) or 52 weeks (B) of culture. C and D represent RT–PCR amplification of mRNA samples isolated from ARPE-19 cells maintained in culture for 1, 2, 5, 7, 10, 12, and 52 weeks, using primers to detect mRNA for either αSMA (C) or RPE65 (D). E represents RT–PCR amplification for a series of 25, 30, or 35 cycles to detect αSMA using mRNA isolated from ARPE-19 cells that are undifferentiated (U) differentiated (D). The first lane in C-E represents a DNA standard ladder of 300, 400, and 500 bp.
Figure 11
Figure 11
Reverse transcriptase polymerase chain reaction amplification of transcription response element mRNAs during ARPE-19 retinal pigment epithelium cell differentiation RNA was isolated from undifferentiated and differentiated ARPE-19 cells and subjected to RT–PCR analysis to detected transcription response element (TRE) mRNAs as described in Methods. In A, all reactions were performed for 40 cycles, where lane 1 represents DNA standards, lane 15 represents the positive control primers for GADPH, and lane 16 is the negative control with no mRNA template. The intervening lanes in A represent primers specific for the following TFs: 2 Core binding factor, 3 E2F1, 4 Evi-1, 5 GATA1, 6 HNF-1, 7 IRF-1, 8 Nkx2–5, 9 NKX3A, 10 Oct-1, 11 SMAD3, 12 SREBP-1, 13 TFE3, 14 v-Myb. In B, semi-quantitative RT–PCR was also done for either 30, 35, or 40 cycles as indicated using primers specific for GATA-1, IRF-1, or SMAD3. The first lane in A represents a standard DNA ladder at 300, 400, and 500 bp, while in B the DNA standards are at 400 and 500 bp.
Figure 12
Figure 12
Reverse transcriptase polymerase chain reaction amplification of transcription response elements mRNAs during chick embryo retinal pigment epithelium cell differentiation RNA was isolated from undifferentiated cultured chick embryo retinal pigment epithelium (RPE) cells or differentiated fresh RPE tissue and subjected to RT–PCR analysis to detect transcription response elements (TREs) mRNAs as described in Methods. Lanes 1 and 11 represent DNA standard ladders at 300, 400, 500, 600, and 700 bp, lane 10 represents the positive control for GADPH, and the remaining lanes represent primers specific for the following TFs: 2 FoxD3, 3 AML-1, 4 HNF-3α, 5 HNF-1, 6 E2F1, 7 DP1, 8 TFII-I, 9 SREBP-1.
Figure 13
Figure 13
Reverse transcriptase polymerase chain reaction amplification of EMT-associated transcription response elements mRNAs during ARPE-19 and chick embryo retinal pigment epithelium cell differentiation RNA was isolated from undifferentiated and differentiated ARPE-19 or chick embryo retinal pigment epithelium (cRPE) cells and subjected to RT–PCR analysis to detect transcription response elements (TRE) mRNAs as described in Methods. Lanes 1 and 16 represent DNA standard ladders at 300, 400, and 500 bp, lanes 8 and 15 represent the positive controls for GADPH, and the remaining lanes represent primers specific for the following TFs: 2 and 9, Slug; 3 and 10, Snail; 4 and 11, Twist; 5 and 12, SIP-1; 6 and 13, SMAD-2; 7 and 14, LEF-1.
Figure 14
Figure 14
Comprehensive cross-species models for reciprocal regulation of genes during retinal pigment epithelium cell differentiation Models for regulatory regions, including promoters and first introns, of differentiated and undifferentiated gene clusters, were constructed as described in the text. transcription response elements (TREs) inclusion criteria indicated in these models are frequency ratio, evolutionary conservation factor, and RT–PCR detection of mRNA expression. Symbols representing TREs indicates passage of corresponding criteria filter, as indicated in key, by TRE, filled boxes signify that a TRE has passed all criteria filters.

Similar articles

Cited by

References

    1. Martinez-Morales JR, Rodrigo I, Bovolenta P. Eye development: a view from the retina pigmented epithelium. Bioessays. 2004;26:766–77. - PubMed
    1. Grunwald G. Structure and Function of the Retinal Pigment Epithelium.In: Tasman W, Jaeger EA, editors. Foundations of Clinical Ophthalmology. Philadelphia(PA): Lippincott, Williams and Wilkins; 2004. p. 1–21.
    1. Strauss O. The retinal pigment epithelium in visual function. Physiol Rev. 2005;85:845–81. - PubMed
    1. Rodriguez de la Rua E, Pastor JC, Aragon J, Mayo-Iscar A, Martinez V, Garcia-Arumi J, Giraldo A, Sanabria-Ruiz Colmenares MR, Miranda I. Interaction between surgical procedure for repairing retinal detachment and clinical risk factors for proliferative vitreoretinopathy. Curr Eye Res. 2005;30:147–53. - PubMed
    1. Grierson I, Hiscott P, Hogg P, Robey H, Mazure A, Larkin G. Development, repair and regeneration of the retinal pigment epithelium. Eye. 1994;8:255–62. - PubMed

Publication types

MeSH terms

Substances

LinkOut - more resources