. 2008 Aug 4:14:1401-13.

Monocular visual deprivation in macaque monkeys: a profile in the gene expression of lateral geniculate nucleus by laser capture microdissection

Affiliations

Monocular visual deprivation in macaque monkeys: a profile in the gene expression of lateral geniculate nucleus by laser capture microdissection

Georgiana Cheng et al. Mol Vis. .

Abstract

Purpose: Amblyopia is the most common cause of visual impairment in children. Early detection of amblyopia and subsequent intervention are vital in preventing visual loss. Understanding the molecular pathogenesis of amblyopia would greatly facilitate development of therapeutic interventions. An animal model of amblyopia induced by monocular vision deprivation has been extensively studied in terms of anatomic and physiologic alterations that affect visual pathways. However, the molecular events underlying these changes are poorly understood. This study aimed to characterize changes of gene expression profiles in the lateral geniculate nucleus (LGN) associated with amblyopia induced by monocular visual deprivation.

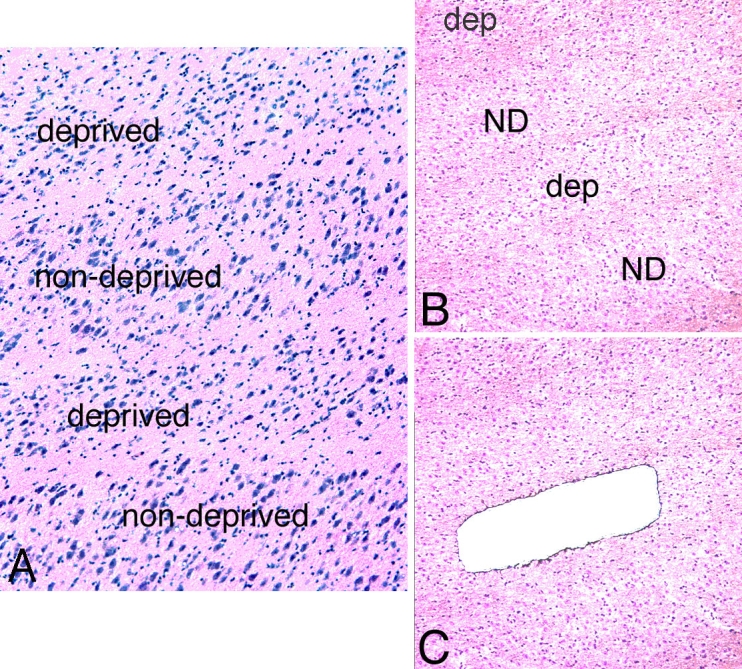
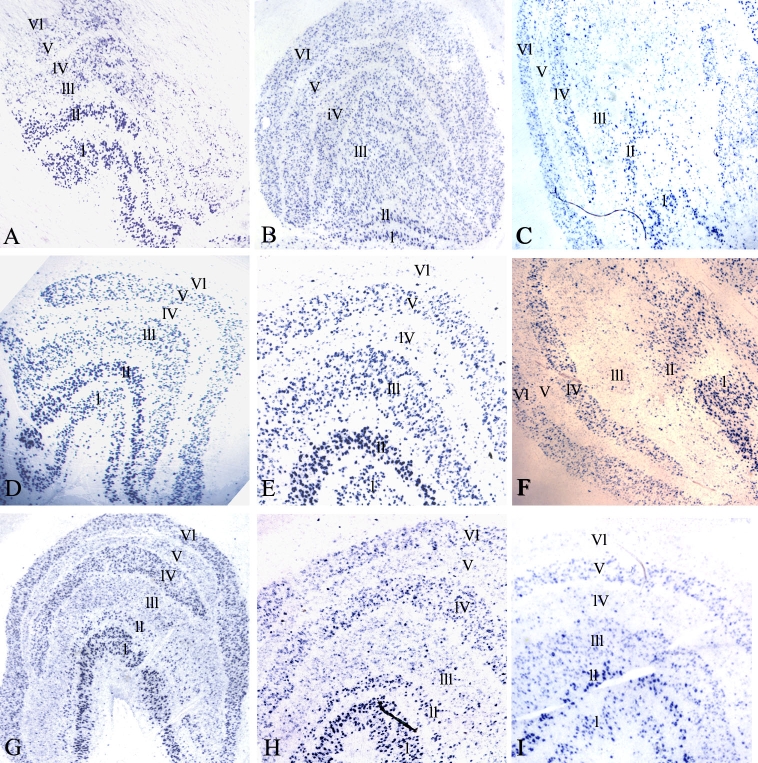
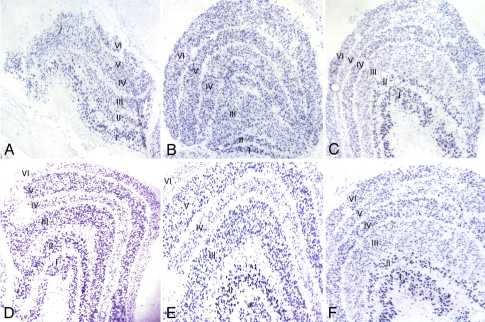
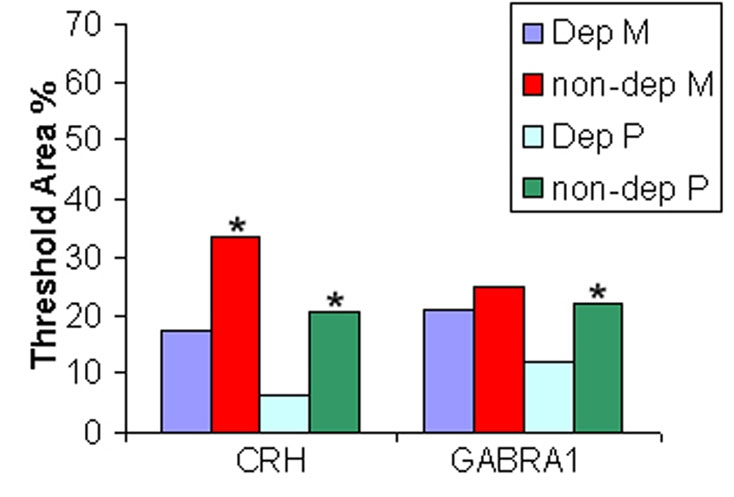
Methods: Monocular vision deprivation was generated by either opaque dark contact lens or tarsorrhaphy of newborn rhesus monkeys. LGN was harvested at two or four months following induction of vision deprivation. Laser capture microdissection was used to obtain individual LGN layers for total RNA isolation. Linear T7-based in vitro RNA amplification was used to obtain sufficient RNA to conduct DNA microarray studies. The resulting Affymetrix GeneChip Expression data were analyzed using Affymetrix GeneChip Operating Software. Real-time quantitative polymerase chain reaction and in situ hybridization were used to further analyze expression of selected genes.

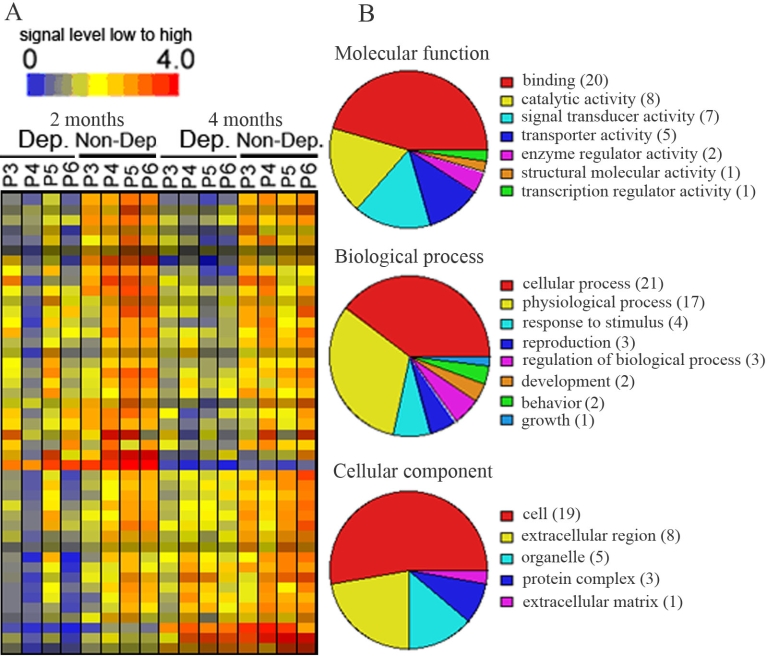
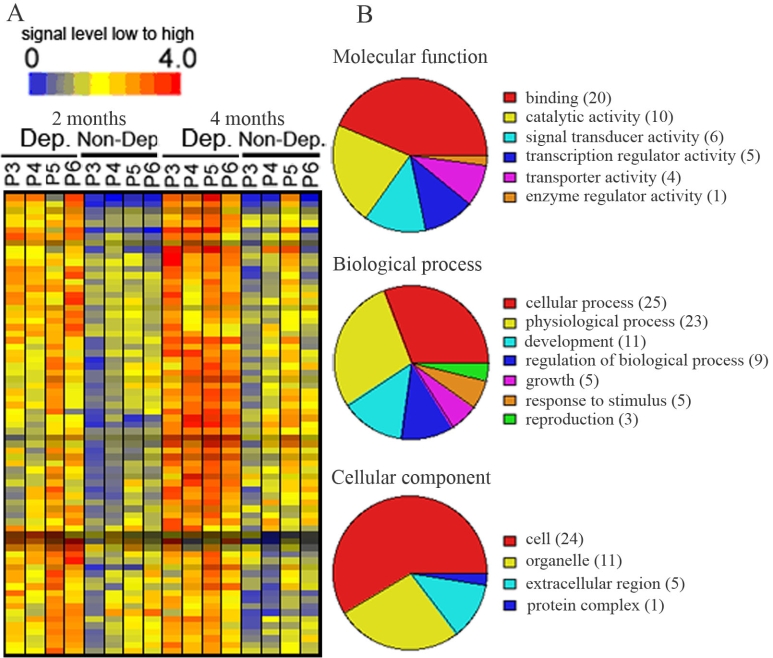
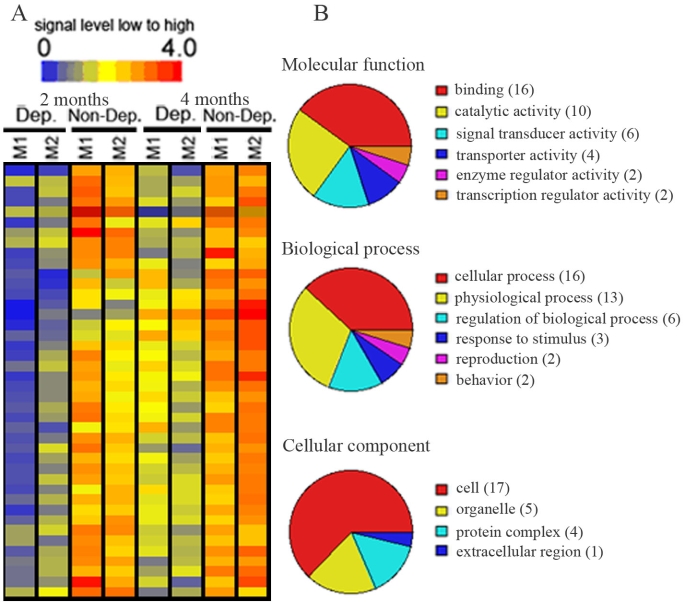
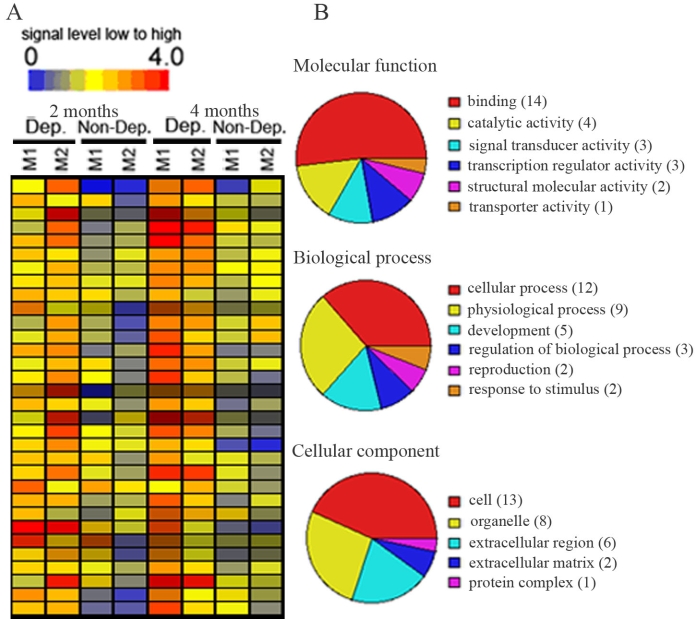
Results: Using 52,699 microarray probe sets from a Rhesus array, we identified 116 transcripts differentially expressed between deprived and nondeprived parvocellular layers: 45 genes were downregulated and 71 genes were upregulated in deprived parvocellular layers. We also observed substantial changes in deprived magnocellular laminae: 74 transcripts exhibited altered expression, 42 genes were downregulated, and 32 genes were upregulated. The genes identified in this study are involved in many diverse processes, including binding (calcium ion binding, nucleic acid binding, and nucleotide binding), catalytic activity, and signal transducer activity.

Conclusions: There were significant differences in gene expression profiles between deprived and nondeprived parvocellular layers and magnocellular laminae of LGN. These alterations in gene expression may play a critical role in the molecular pathogenesis of amblyopia. The genes identified in this study may provide potential targets for therapeutic intervention of this disease.


Figures

Figure 1
Figure 1
Morphology of LGN parvocellular layers from a monkey with monocular vision deprivation. A: H&E staining of lateral geniculate nucleus (LGN) sections showed neuronal shrinkage in deprived parvocellular layers as compared with non-deprived layers. B: Low power magnification deprived layer of LGN sections before laser capture microdissection (LCM). C: Low power magnification deprived layer of LGN sections after LCM. Abbreviations: dep: deprived layer; ND: non-deprived layer.
Figure 2
Figure 2
Transcripts that were downregulated in deprived parvocellular layers as compared with non-deprived layers of 2 or 4 months after monocular vision deprivation. A: Hierarchical dendogran analysis displayed genes downregulated (blue to green color) in deprived layers as compared with non-deprived layers. B: Pie chart displayed functional categorization of genes that were downregulated in deprived layers. Number in parentheses indicated how many genes involved in that category function. P3-P6 represent parvocellular layer III to VI. Abbreviations: Dep: deprived layer; Non-Dep: non-deprived layer; 2 months or 4 months: 2 or 4 months of monocular vision deprivation.
Figure 3
Figure 3
Transcripts that were upregulated in deprived parvocellular layers as compared with non-deprived layers of 2 or 4 months after monocular vision deprivation. A: Hierarchical dendogran analysis displayed genes upregulated (orange to red color) in deprived layers as compared with non-deprived layers. B: Pie chart displayed functional categorization of genes that were upregulated in deprived layers. Number in parentheses indicated how many genes involved in that category function. P3-P6 represent parvocellular layer III to VI. Abbreviations: Dep: deprived layer; Non-Dep: non-deprived layer.2 months or 4 months: 2 or 4 months of monocular vision deprivation.
Figure 4
Figure 4
Transcripts that were downregulated in deprived magnocellular layers as compared with non-deprived layers of 2 or 4 months after monocular vision deprivation. A: Hierarchical dendogran analysis displayed genes downregulated (blue to green color) in deprived layers as compared with non-deprived layers. B: Pie chart displayed functional categorization of genes that were downregulated in deprived layers. Number in parentheses indicated how many genes involved in that category function. M1-M2 represent magnocellular layer I to II. Abbreviations: Dep: deprived layer; Non-Dep: non-deprived layer; 2 months or 4 months: 2 or 4 months of monocular vision deprivation.
Figure 5
Figure 5
Transcripts that were upregulated in deprived magnocellular layers as compared with non-deprived layers of 2 or 4 months after monocular vision deprivation. A: Hierarchical dendogran analysis displayed genes upregulated (orange to red color) in deprived layers as compared with non-deprived layers. B: Pie chart displayed functional categorization of genes that were upregulated in deprived layers. Number in parentheses indicated how many genes involved in that category function. M1-M2 represent magnocellular layer I to II. Abbreviations: Dep: deprived layer; Non-Dep: non-deprived layer. 2 months or 4 months: 2 or 4 months of monocular vision deprivation.
Figure 6
Figure 6
In situ hybridization of CRH in control and LGN. A and B: CRH expression in the LGN of two control monkeys (C1and C2). C: Ipsilateral LGN of a monkey that was monocular vision-deprived for four months (MD5). D: CRH showed decreased expression in deprived layers (layers I, IV, and VI) in the LGN contralateral to the eye from a monkey that was monocular vision-deprived for four months (MD3). E. Higher-magnification photomicrograph of D. F: Ipsilateral LGN from a monkey that was monocular vision-deprived for two (MD2). G. CRH showed decreased expression in deprived layers (layers II, III, and V) in the LGN ipsilateral to the eye from a monkey that was monocular vision-deprived for four months (MD4). H: Higher-magnification photomicrograph of G. I: Contralateral LGN eye from a monkey that was monocular vision-deprived for four months (MD4).
Figure 7
Figure 7
In situ hybridization of GABRA1 in control and deprived LGN. A and B: GABRA1 expression in the LGN of two control monkeys (C1 and C2). C: GABRA1 showed decreased expression in deprived layers (layers II, III, and V) in the LGN ipsilateral to the eye from a monkey that was monocular vision-deprived for four months (MD4). D: GABRA1 showed decreased expression in deprived layers (layers I, IV, and VI) in the LGN contralateral to the eye from a monkey that was monocular vision-deprived for four months (MD3). E: Higher-magnification photomicrograph of D. F: Higher-magnification photomicrograph of C.
Figure 8
Figure 8
Quantification for in situ hybridization of CRH and GABRA1 in deprived LGN. Percent threshold area represents the percentage of area in a given layer that contains a positive in situ hybridization signal. The purple colored graph bar is Dep M which indicates deprived magnocellular layers. The red colored graph bar is non-dep M which indicates nondeprived magnocellular layers. The light blue colored graph bar is Dep P which indicates deprived parvocellular layers. The green colored graph bar is non-dep P which indicates nondeprived parvocellular layers. The asterisk Denotes a p<0.05 for deprived layers compared to nondeprived layers.

Similar articles

Cited by

References

    1. von Noorden GK, Crawford ML, Levacy RA. The lateral geniculate nucleus in human anisometropic amblyopia. Invest Ophthalmol Vis Sci. 1983;24:788–90. - PubMed
    1. von Noorden GK, Crawford ML. The lateral geniculate nucleus in human strabismic amblyopia. Invest Ophthalmol Vis Sci. 1992;33:2729–32. - PubMed
    1. Daw NW. Critical periods and amblyopia. Arch Ophthalmol. 1998;116:502–5. - PubMed
    1. Headon MP, Sloper JJ, Hiorns RW, Powell TP. Effects of monocular closure at different ages on deprived and undeprived cells in the primate lateral geniculate nucleus. Brain Res. 1985;350:57–78. - PubMed
    1. Sloper JJ, Headon MP, Powell TP. Simultaneous hypertrophy of cells related to each eye in the lateral geniculate nucleus of the infant monkey following short-term reverse suture. Brain Res. 1984;317:295–7. - PubMed

Publication types

MeSH terms