

Transthyretin and complex protein pattern in aqueous humor of patients with primary open-angle glaucoma
- PMID: 18682810
- PMCID: PMC2493027
Transthyretin and complex protein pattern in aqueous humor of patients with primary open-angle glaucoma
Abstract
Purpose: To analyze protein patterns in the aqueous humor of glaucoma patients in comparison to control subject using two different methods.
Methods: Aqueous humor was collected from 52 patients with primary open-angle glaucoma (POAG) and from 55 control subjects (CO). Twenty-two POAG samples and 24 CO samples were used for protein profiling through surface enhanced laser desorption/ionization-time of flight-mass spectrometry (SELDI-TOF-MS) ProteinChip arrays. The data were analyzed by multivariate statistical methods and artificial neural networks. One highly significant biomarker was identified through matrix assisted laser desorption/ionisation time of flight-mass spectrometry (MALDI-TOF). Thirty samples from patients with POAG and 31 control samples were analyzed through two-dimensional electrophoresis. Subsequently, the protein spots of all gels were detected, and the two groups were compared. One spot group exhibiting clear differential abundance was identified by mass spectrometry (electrospray ionization mass spectrometry).
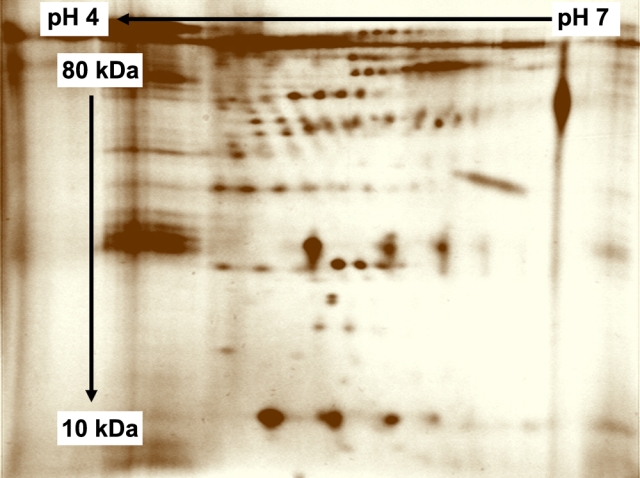
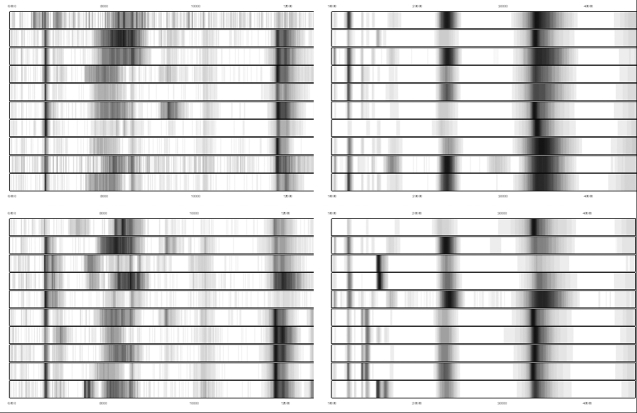
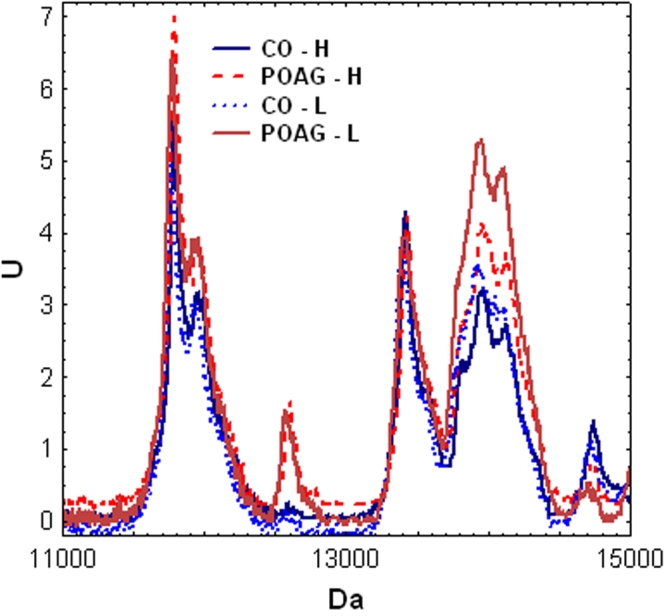
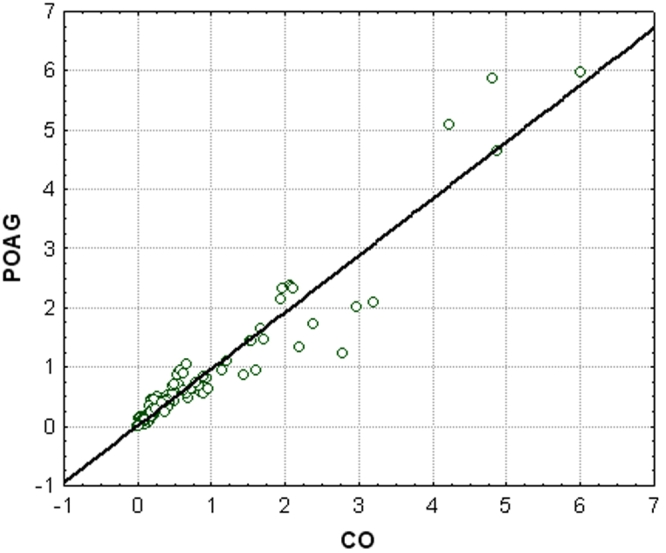
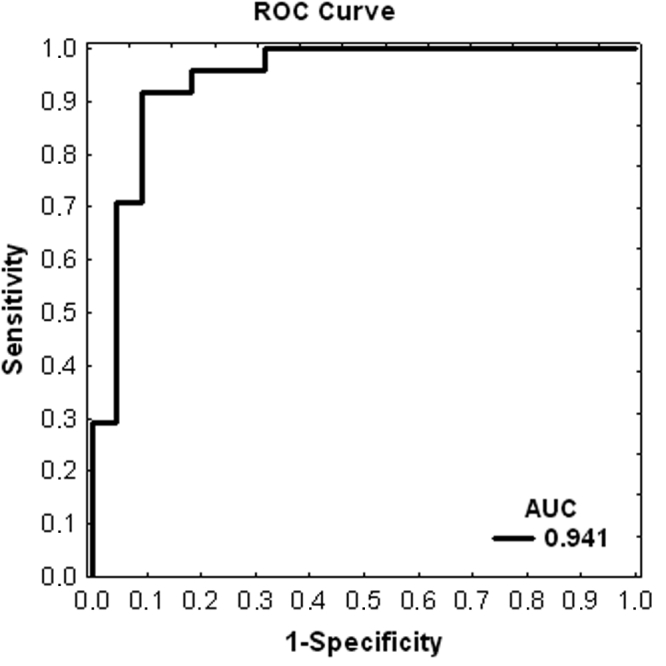
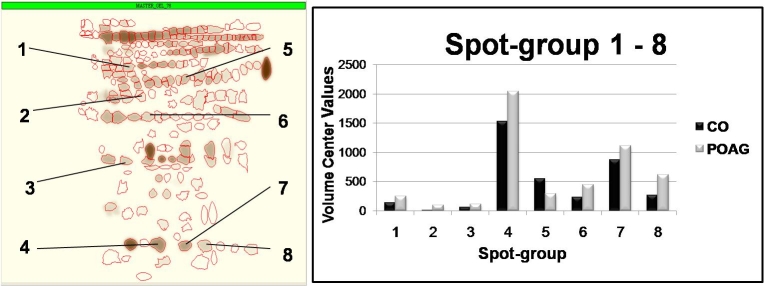
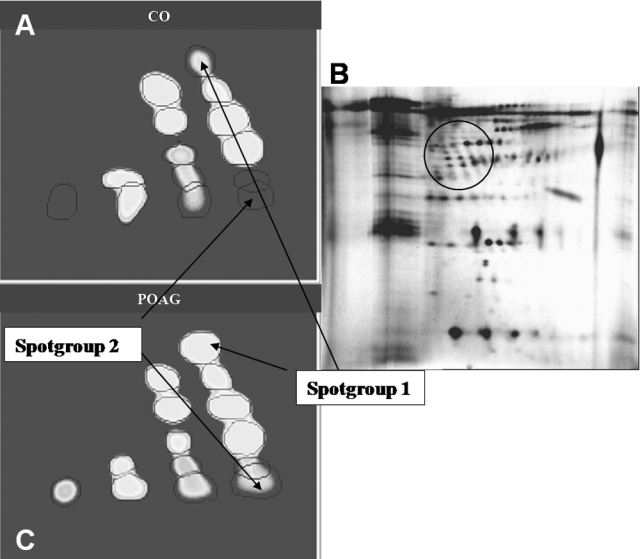
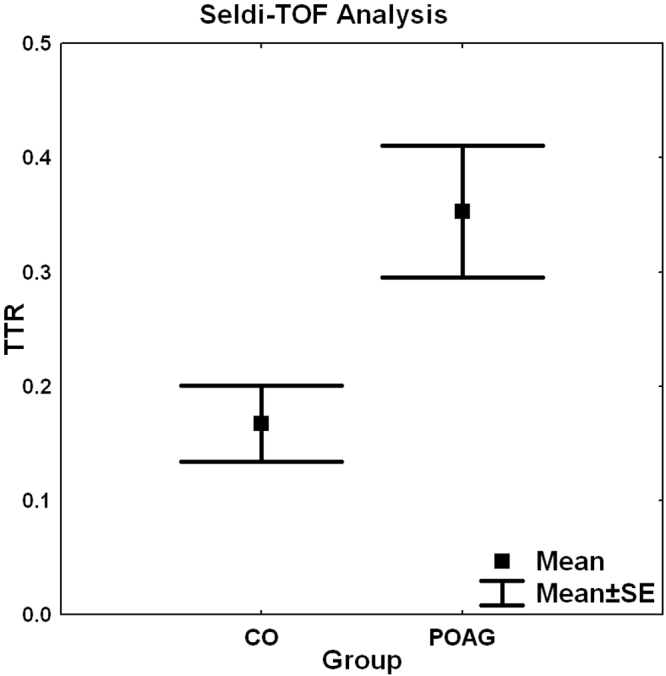
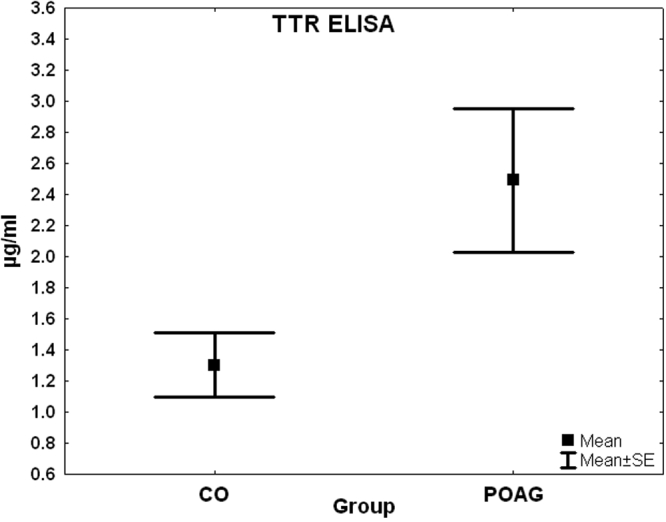
Results: In the samples analyzed by SELDI-TOF-MS, about 250 protein peaks could be consistently clustered in both groups. The analyses revealed eight biomarkers, which discriminated glaucoma from non-glaucoma controls with a sensitivity of 90% and a specificity of 87%. These biomarkers were purified further, and one marker, which was upregulated in glaucoma patients (p=0.006), was identified as transthyretin. The upregulation of transthyretin in POAG patients was also confirmed by enzyme linked immunosorbent assay (ELISA; p=0.03). In all samples analyzed by two-dimensional electrophoresis, complex protein patterns were detected in a total of 177 spot groups. The aqueous humor of all glaucoma patients revealed some regions that were clearly different from the controls. Several spots were significantly increased in the aqueous humor of glaucoma patients. One of the proteins that is highly abundant in the aqueous of glaucoma patients was identified as transthyretin.
Conclusions: The aqueous humor of glaucoma patients revealed characteristic differences in protein/peptide profiles from control patients using two different analytical methods, SELDI-TOF-MS and two-dimensional electrophoresis. Interestingly, we could detect elevated transthyretin concentrations in glaucoma samples. Transthyretin might play a role in the onset of glaucoma since it has been shown to form amyloid deposits. These particles could cause outflow obstructions thereby increasing intraocular pressure as a possible onset mechanism.
Figures
Similar articles
-
Proteomic analysis of aqueous humor from patients with primary open angle glaucoma.Mol Vis. 2010 Dec 18;16:2839-46. Mol Vis. 2010. PMID: 21203405 Free PMC article.
-
[Aqueous humor protein concentration in patients with primary open-angle glaucoma under clinical treatment].Arq Bras Oftalmol. 2007 Mar-Apr;70(2):217-20. doi: 10.1590/s0004-27492007000200006. Arq Bras Oftalmol. 2007. PMID: 17589689 Portuguese.
-
IgG antibody patterns in aqueous humor of patients with primary open angle glaucoma and pseudoexfoliation glaucoma.Mol Vis. 2007 Sep 5;13:1573-9. Mol Vis. 2007. PMID: 17893658
-
Aqueous humor interleukin-6 levels in primary open-angle glaucoma (POAG): A systematic review and meta-analysis.Arch Soc Esp Oftalmol (Engl Ed). 2020 Jul;95(7):315-321. doi: 10.1016/j.oftal.2020.03.018. Epub 2020 May 12. Arch Soc Esp Oftalmol (Engl Ed). 2020. PMID: 32414512 English, Spanish.
-
[The progress of aqueous humor outflow pathway in open-angle glaucoma].Zhonghua Yan Ke Za Zhi. 2011 Oct;47(10):953-6. Zhonghua Yan Ke Za Zhi. 2011. PMID: 22321508 Review. Chinese.
Cited by
-
Proteome alterations in the aqueous humor reflect structural and functional phenotypes in patients with advanced normal-tension glaucoma.Sci Rep. 2022 Jan 24;12(1):1221. doi: 10.1038/s41598-022-05273-0. Sci Rep. 2022. PMID: 35075201 Free PMC article.
-
Compound electrolyte intraocular irrigating solution produces better effects on vision recovery of cataract patients after surgery than Ringer lactate solution.Int Ophthalmol. 2024 Jun 17;44(1):233. doi: 10.1007/s10792-024-03131-8. Int Ophthalmol. 2024. PMID: 38886282 Clinical Trial.
-
Transthyretin as a potential biomarker for the differential diagnosis between lung cancer and lung infection.Biomed Rep. 2014 Sep;2(5):765-769. doi: 10.3892/br.2014.313. Epub 2014 Jul 11. Biomed Rep. 2014. PMID: 25054025 Free PMC article.
-
Aqueous humor erythropoietin levels in open-angle glaucoma patients with and without TTR V30M familial amyloid polyneuropathy.Mol Vis. 2014 Jul 2;20:970-6. eCollection 2014. Mol Vis. 2014. PMID: 25018619 Free PMC article.
-
The Human Eye Proteome Project: perspectives on an emerging proteome.Proteomics. 2013 Aug;13(16):2500-11. doi: 10.1002/pmic.201300075. Proteomics. 2013. PMID: 23749747 Free PMC article. Review.
References
-
- Knauer C, Pfeiffer N. Ophthalmologe. 2006;103:735–41. Blindness in Germany--today and in 2030. - PubMed
-
- Flammer J, Orgul S, Costa VP, Orzalesi N, Krieglstein GK, Serra LM, Renard JP, Stefansson E. The impact of ocular blood flow in glaucoma. Prog Retin Eye Res. 2002;21:359–93. - PubMed
-
- Grieshaber MC, Orgul S, Schoetzau A, Flammer J. Relationship between retinal glial cell activation in glaucoma and vascular dysregulation. J Glaucoma. 2007;16:215–9. - PubMed
-
- Kumar DM, Agarwal N. Oxidative stress in glaucoma: a burden of evidence. J Glaucoma. 2007;16:334–43. - PubMed
-
- Grus FH, Joachim SC, Wuenschig D, Rieck J, Pfeiffer N. Autoimmunity and glaucoma. J Glaucoma. 2008;17:79–84. - PubMed
MeSH terms
Substances
LinkOut - more resources
Full Text Sources
Other Literature Sources
Research Materials