. 2008 Aug 6;3(8):e2905.
doi: 10.1371/journal.pone.0002905.

Maintenance of large subpopulations of differentiated CD8 T-cells two years after cytomegalovirus infection in Gambian infants

Affiliations

Maintenance of large subpopulations of differentiated CD8 T-cells two years after cytomegalovirus infection in Gambian infants

David J C Miles et al. PLoS One. .

Abstract

Background: In a previously published study, we found that large differentiated subpopulations of CD8 T-cells emerged rapidly after CMV infection in young infants and persisted throughout the following year. Here we describe a follow-up study conducted on the same infants to establish whether the differentiated subpopulations continued through the second year post-infection.

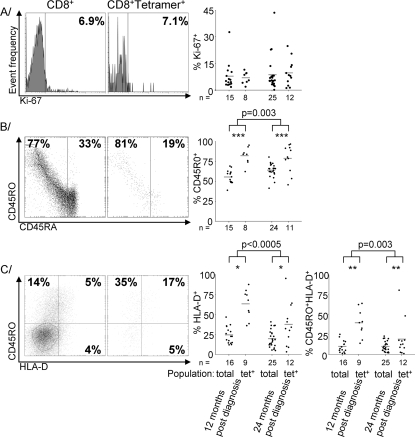
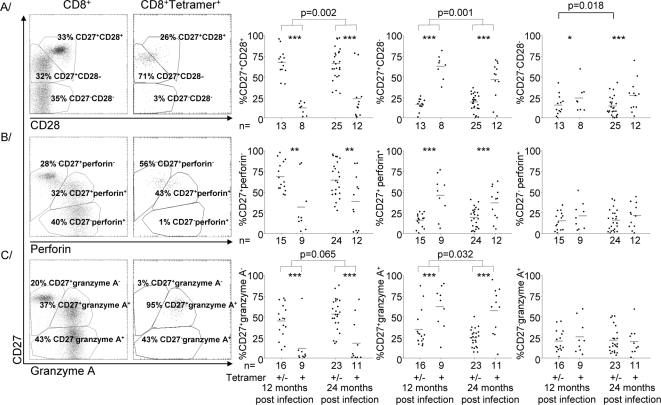
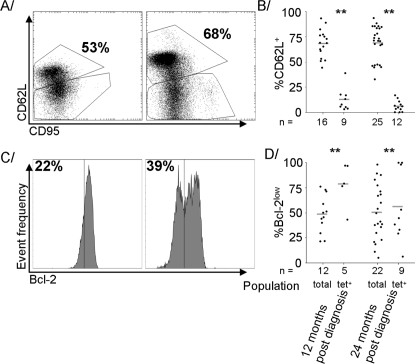
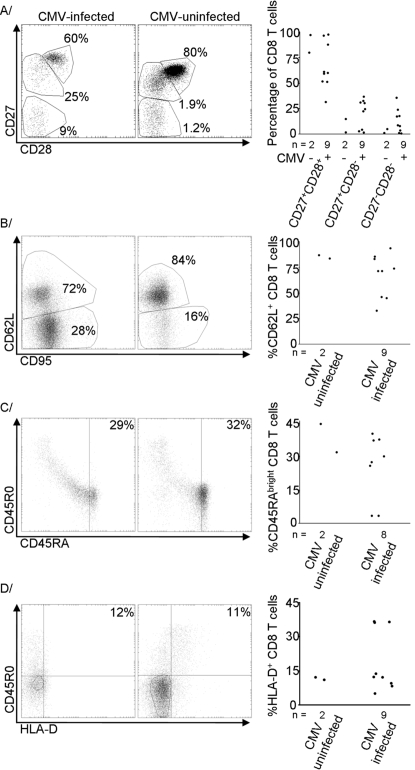
Methodology / principal findings: CMV-specific cells identified using tetramers remained more activated and differentiated than the overall CD8 population. The large subpopulation of differentiated cytotoxic (CD28(-)CD62L(-)Bcl-2(low)CD95(+)perforin(+)) cells that emerged rapidly after infection remained stable after two years. No similar subpopulation was found in CMV-uninfected infants indicating that two years after infection, CMV remained a major factor in driving CD8 T-cell differentiation. Although markers of activation (CD45R0 and HLA-D) declined throughout the first year, HLA-D expression continued to decline during the second year and CD45R0 expression increased slightly. The age-related increase in IFNgamma response observed during the first year continued but was non-significant during the second year, indicating that the rate of functional improvement had slowed substantially. CONCLUSIONS / SIGNIFICANCE: The large differentiated subpopulations of CD8 T-cells that had emerged immediately after CMV infection persisted through the second year post-infection, while levels of activation and functional capacity remained fairly constant.


Conflict of interest statement

Competing Interests: The authors have declared that no competing interests exist.

Figures

Figure 1
Figure 1. Tetramer+ CD8 T-cells are more activated than the overall CD8 T-cell population, but no more so at 24 than 12 months post-diagnosis.
A histograms of the expression of Ki-67 in the overall CD8 T-cell population and tetramer+ subpopulation of a representative sample collected 24 months post-diagnosis, with individual value plots indicating proportions of Ki-67+. B scatter plots of the expression of CD45R0 and CD45RA in the overall CD8 T-cell population and tetramer+ subpopulation of a representative sample collected 24 months post-diagnosis, with individual value plots indicating proportions of CD45R0+ cells and the CD45 ratio derived from all samples. C scatter plots of the expression of CD45R0 and HLA-D in the overall CD8 T-cell population and tetramer+ subpopulation of a representative sample collected 24 months post-diagnosis, with individual value plots indicating proportions of HLA-D+ and CD45R0+HLA-D+ cells and the CD45 ratio derived from all samples. Significances indicate differences between both overall and tetramer+ subpopulations. Grey bars indicate means. Significant differences between tetramer+ and overall CD8 T-cell populations are indicated by *p<0.05, **p<0.005 or ***p<0.0005.
Figure 2
Figure 2. Tetramer+ cells are more differentiated than the overall CD8 T-cell population, but there is little change in the relative proportions of the subpopulations in the second year post-diagnosis.
A Scatter plots of the expression of CD27 and CD28 gated on all CD8 T-cells and on tetramer+ CD8 T-cells, and individual value plots of the percentages of cells that fell into each of the defined subpopulations within the overall CD8 and tetramer+ populations. B Scatter plots of the expression of CD27 and perforin gated on all CD8 T-cells and on tetramer+ CD8 T-cells, and individual value plots of the percentages of cells that fell into each of the defined subpopulations within the overall CD8 and tetramer+ populations. C Scatter plots of the expression of CD27 and granzyme A gated on all CD8 T-cells and on tetramer+ CD8 T-cells, and individual value plots of the percentages of cells that fell into each of the defined subpopulations within the overall CD8 and tetramer+ populations. Significant differences between sample times are indicated where present. Grey bars indicate means. Significant differences between tetramer+ and overall CD8 T-cell populations are indicated by *p<0.05, **p<0.005 or ***p<0.0005.
Figure 3
Figure 3. A higher proportion of CD8 T-cells were CD62L+ at 24 months than 12, but distribution between the Bcl-2low and Bcl-2high subpopulations remained constant.
A Scatter plots of expression of CD62L and CD95 in the overall T-cell population at 12 and 24 months post-diagnosis in a representative sample. B Individual value plots of proportions of CD62L+ cells among tetramer+ and overall CD8 T-cell populations at 12 and 24 months post-diagnosis. C Histograms of expression of Bcl-2 in the overall T-cell population at 12 and 24 months post-diagnosis in a representative sample. D Individual value plots of proportions of Bcl2low cells among tetramer+ and overall CD8 T-cell populations at 12 and 24 months post-diagnosis. Grey bars indicate means. Significant differences between sample times are indicated where present. ** indicates difference between tetramer+ cells and overall population significant at p<0.005.
Figure 4
Figure 4. The CD8 T-cells of CMV-infected infants were more differentiated but no more activated than those of CMV-uninfected infants at 24 months of age.
A Scatter plots of expression of CD27 and CD28 in representative samples and relative sizes of the three defined subpopulations in all infants sampled at 24 months of age. B Scatter plots of expression of CD62L and CD95 in representative samples and relative sizes of the CD62L+ subpopulation in all infants sampled at 24 months of age. C Scatter plots of expression of CD45R0 and CD45RA in representative samples and relative sizes of the CD45RAbrightCD45R0 subpopulation in all infants sampled at 24 months of age. D Scatter plots of expression of CD45R0 and HLA-D in representative samples and relative sizes of the HLA-D+ subpopulation in all infants sampled at 24 months of age. Representative scatter plots are selected as those with the lower proportion of cells in the subpopulation of interest, or the CD27+CD28+ subpopulation for part A, among CMV-uninfected infants and the median proportion for CMV-infected infants.

References

    1. Pass RF. Epidemiology and transmission of cytomegalovirus. J Infect Dis. 1985;152:243–248. - PubMed
    1. Gamadia L, Remmerswaal E, Weel J, Bemelman F, van Lier R, et al. Primary immune responses to human CMV: a critical role for IFN-γ-producing CD4+ T cells in protection against CMV disease. Blood. 2003;101:2686–2692. - PubMed
    1. Sylwester A, Mitchell B, Edgar J, Taormina C, Pelte C, et al. Broadly targeted human cytomegalovirus-specific CD4+ and CD8+ T cells dominate the memory compartments of exposed subjects. J Exp Med. 2005;202:673–685. - PMC - PubMed
    1. Chen S, Tu W-W, Sharp M, Tongson E, He X-S, et al. Antiviral CD8 T cells in the control of primary human cytomegalovirus infection in early childhood. J Infect Dis. 2004;189:1619–1627. - PubMed
    1. Komatsu H, Inui A, Sogo T, Fujisawa T, Nagasaka H, et al. Large scale analysis of pediatric antiviral CD8+ T cell populations reveals sustained, functional and mature responses. Immun Ageing. 2006;3:11. - PMC - PubMed

Publication types