Comparative Study
. 2008 Aug 6:9:375.
doi: 10.1186/1471-2164-9-375.

Pooling breast cancer datasets has a synergetic effect on classification performance and improves signature stability

Affiliations
Comparative Study

Pooling breast cancer datasets has a synergetic effect on classification performance and improves signature stability

Martin H van Vliet et al. BMC Genomics. .

Abstract

Background: Michiels et al. (Lancet 2005; 365: 488-92) employed a resampling strategy to show that the genes identified as predictors of prognosis from resamplings of a single gene expression dataset are highly variable. The genes most frequently identified in the separate resamplings were put forward as a 'gold standard'. On a higher level, breast cancer datasets collected by different institutions can be considered as resamplings from the underlying breast cancer population. The limited overlap between published prognostic signatures confirms the trend of signature instability identified by the resampling strategy. Six breast cancer datasets, totaling 947 samples, all measured on the Affymetrix platform, are currently available. This provides a unique opportunity to employ a substantial dataset to investigate the effects of pooling datasets on classifier accuracy, signature stability and enrichment of functional categories.

Results: We show that the resampling strategy produces a suboptimal ranking of genes, which can not be considered to be a 'gold standard'. When pooling breast cancer datasets, we observed a synergetic effect on the classification performance in 73% of the cases. We also observe a significant positive correlation between the number of datasets that is pooled, the validation performance, the number of genes selected, and the enrichment of specific functional categories. In addition, we have evaluated the support for five explanations that have been postulated for the limited overlap of signatures.

Conclusion: The limited overlap of current signature genes can be attributed to small sample size. Pooling datasets results in more accurate classification and a convergence of signature genes. We therefore advocate the analysis of new data within the context of a compendium, rather than analysis in isolation.


Figures

Figure 1
Figure 1
Result of the repeated random resampling procedure on the Veer et al.[1] data. The histogram shows the frequencies of genes being among the top 200 genes over 500 resamplings. Below the histogram, two lanes containing light-blue bars indicate the genes that are part of the published signatures. The red line indicates the frequency threshold corresponding to the expected value of the frequency under the null hypothesis (no information) given the number of genes N that is selected in each of the R resamplings.
Figure 2
Figure 2
Spearman rank correlation of the ranking obtained after resampling an artificial dataset and the true ranking. The number of informative genes was varied from 500 (A and D), 2500 (B and E), to 5000 (C and F), and 100 (A, B and C) or 500 (D, E and F) resamplings were considered. The errorbars indicate the mean and standard deviation over 100 repeats of the entire experiment. The results from the 'All Samples', 'Sum of Ranks', and 'Sum of SNRs' methods are equivalent, and are therefore plotted on top of each other (top line in all plots).
Figure 3
Figure 3
Network indicating the synergy between six artificial datasets (Art1 to Art6). Each of these six datasets were generated from the same model, without introducing any noise or heterogeneity. Each node represents a dataset, and each edge the effect on the DLCV error when pooling them. Four different effects were considered, synergy (bright green) when the pooled error is lower than each of the separate errors. Marginal synergy (light blue) when the pooled error is lower than the weighted mean of the separate errors, conversely marginal anti-synergy (yellow) when it is higher. Lastly, true anti-synergy (orange) indicates a higher DLCV error for the pooled dataset.
Figure 4
Figure 4
Scatterplot indicating the classification error relative to the number of datasets that is pooled. A) DLCV error. B) Error on a large independent validation set of 2000 samples. C) Number of genes selected by the DLCV protocol. The color corresponds to the number of datasets that was used. Poolings with the same number of datasets are sorted based on error/number of genes. Labels indicate which combination of datasets was used.
Figure 5
Figure 5
Network indicating the synergy between six real datasets. Each node represents a dataset, and each edge the effect on the DLCV error when pooling them. Four different effects were considered, synergy (bright green) when the pooled error is lower than each of the separate errors. Marginal synergy (light blue) when the pooled error is lower than the weighted mean of the separate errors, conversely marginal anti-synergy (yellow) when it is higher. Lastly, true anti-synergy (orange) indicates a higher DLCV error for the pooled dataset.
Figure 6
Figure 6
Scatterplot indicating the classification error relative to the number of datasets that is pooled. A) DLCV error. B) Error on the Vijver et al. [3] dataset. C) Number of genes selected by the DLCV protocol. The color corresponds to the number of datasets that was used. Poolings with the same number of datasets are sorted based on error/number of genes. Labels indicate which combination of datasets was used.
Figure 7
Figure 7
Enrichment of three gene sets relative to the number of datasets which is pooled. A) GO:0007067: mitosis B) KEGG – hsa04110 – Cell cycle C) GO:0003777: microtubule motor activity. Scatterplots indicate the minus log10 of the Bonferroni corrected p-values. The red line indicates the level at which 0.01 is reached.
Figure 8
Figure 8
Heatmap of the Bonferroni corrected p-values of the enrichment between each signature and a collection of gene sets. Only categories with at least 1 significant association are shown.
Figure 9
Figure 9
Histograms indicating the percentage of genes (A-C) and enriched gene sets (D-F) that overlap between two signatures. A and D) Median histogram and hypergeometric p-value across every pairwise comparison of signatures from single datasets. B and E) Median histogram and hypergeometric p-value across every pairwise comparison of signatures from 2 pooled datasets C and F) Average histogram and hypergeometric p-value across every pairwise comparison of signatures from 3 pooled datasets. We only considered the comparisons of pooled datasets that do not overlap in terms of samples, e.g. the comparison of the signatures from 'Des Loi' and 'Des Paw' is excluded to avoid any bias.
Figure 10
Figure 10
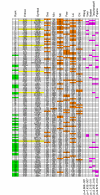
Chart listing the 127 genes selected in the classifier trained on all six datasets. For each gene, we list the rank, Entrez id, and Gene symbol. Green cell shading indicates the genes that are part of the signature from the six pooled datasets, which are not part of any of the signatures from the single datasets. Yellow cell shading indicates the seven microtubule associated genes. The succeeding columns indicate the rank position of a particular gene in each of the six separate rankings. An orange cell shading indicates the genes that were part of the individual signatures. The purple cell shading indicates the overlap to a group of existing breast cancer signatures (Wang et al. [2], Vijver et al. [3], Naderi et al. [19], Teschendorff et al. [20]), and a group of breast cancer associated genes (Pujana et al. [29]). P-values indicating the significance of the overlap (hypergeometric test) of these signatures is given at the bottom of the columns.

References

    1. van't Veer L, Dai H, Vijver M van de, He Y, Hart A, Mao M, Peterse H, Kooy K van der, Marton M, Witteveen A, Schreiber G, Kerhoven R, Roberts C, Linsley P, Bernards R, Friend S. Gene Expression Profiling Predicts Clinical Outcome of Breast Cancer. Nature. 2002;415:530–6. doi: 10.1038/415530a. - DOI - PubMed
    1. Wang Y, Klein J, Zhang Y, Sieuwerts A, Look M, Yang F, Talantov D, Timmermans M, Meijer-van Gelder M, Yu J, Jatkoe T, Berns E, Atkins D, Foekens J. Gene-expression profiles to predict distant metastasis of lymph-node-negative primary breast cancer. Lancet. 2005;365:671–9. - PubMed
    1. Vijver M van de, He Y, van't Veer L, Dai H, Hart A, Voskuil D, Schreiber G, Peterse J, Roberts C, Marton M, Parrish M, Atsma D, Witteveen A, Glas A, Delahaye L, Velde T van der, Bartelink H, Rodenhuis S, Rutgers E, Friend S, Bernards R. A Gene-Expression Signature as a Predictor of Survival in Breast Cancer. N Engl J Med. 2002;347:1999–2009. doi: 10.1056/NEJMoa021967. - DOI - PubMed
    1. Desmedt C, Piette F, Loi S, Wang Y, Lallemand F, Haibe-Kains B, Viale G, Delorenzi M, Zhang Y, d'Assignies MS, Bergh J, Lidereau R, Ellis P, Harris AL, Klijn JGM, Foekens JA, Cardoso F, Piccart MJ, Buyse M, Sotiriou C. Strong Time Dependence of the 76-Gene Prognostic Signature for Node-Negative Breast Cancer Patients in the TRANSBIG Multicenter Independent Validation Series. Clin Cancer Res. 2007;13:3207–3214. doi: 10.1158/1078-0432.CCR-06-2765. - DOI - PubMed
    1. Michiels S, Koscielny S, Hill C. Prediction of Cancer Outcome With Microarrays: A Multiple Random Validation Strategy. The Lancet. 2005;365:488–92. doi: 10.1016/S0140-6736(05)17866-0. - DOI - PubMed

Publication types