. 2008 Oct;82(20):9900-16.
doi: 10.1128/JVI.00928-08. Epub 2008 Aug 6.

Transactivation of cellular genes involved in nucleotide metabolism by the regulatory IE1 protein of murine cytomegalovirus is not critical for viral replicative fitness in quiescent cells and host tissues

Affiliations

Transactivation of cellular genes involved in nucleotide metabolism by the regulatory IE1 protein of murine cytomegalovirus is not critical for viral replicative fitness in quiescent cells and host tissues

Vanessa Wilhelmi et al. J Virol. 2008 Oct.

Abstract

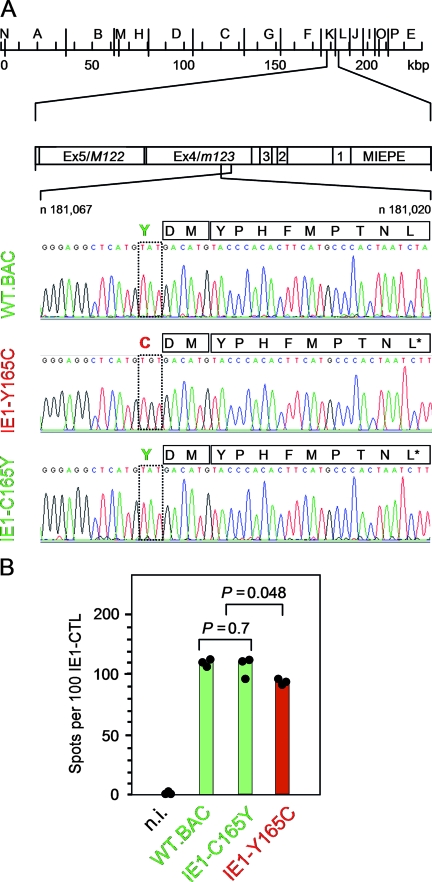
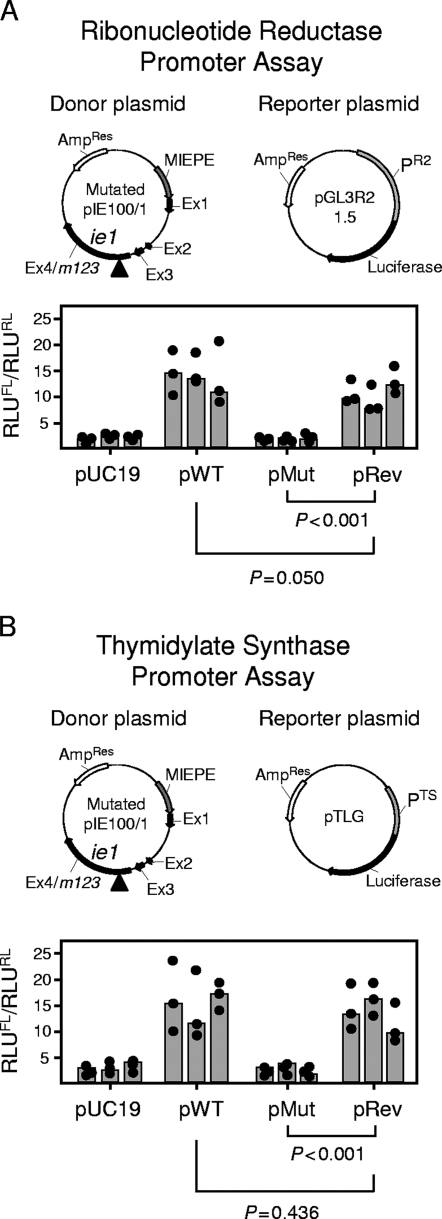
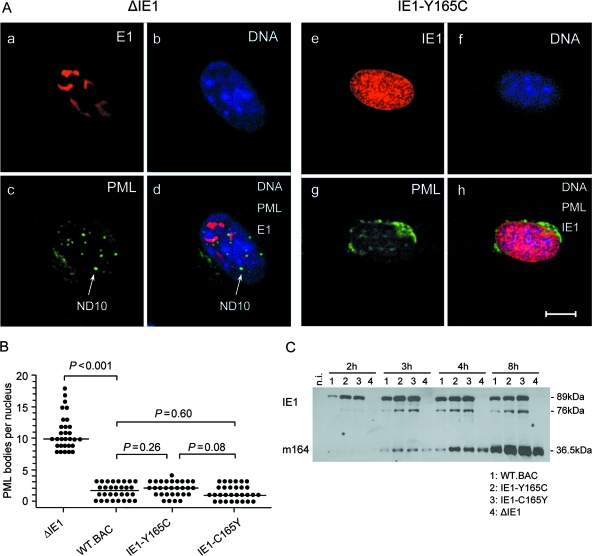
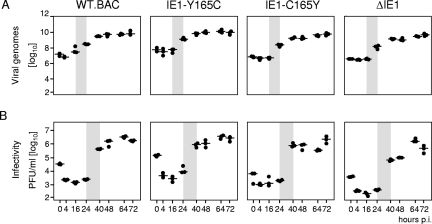
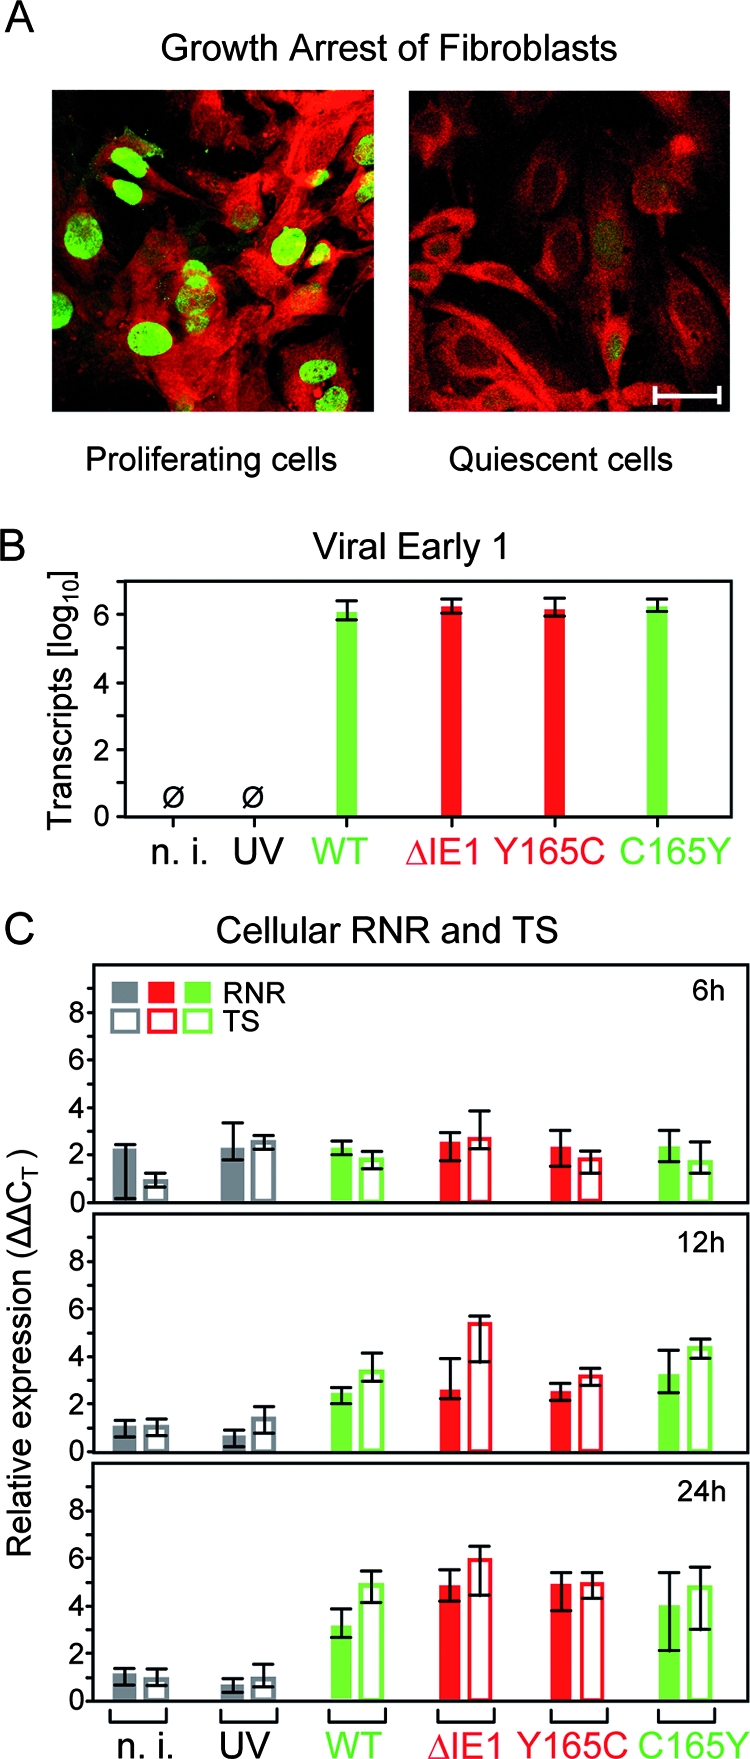
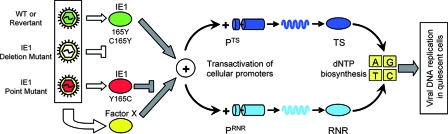
Despite its high coding capacity, murine CMV (mCMV) does not encode functional enzymes for nucleotide biosynthesis. It thus depends on cellular enzymes, such as ribonucleotide reductase (RNR) and thymidylate synthase (TS), to be supplied with deoxynucleoside triphosphates (dNTPs) for its DNA replication. Viral transactivation of these cellular genes in quiescent cells of host tissues is therefore a parameter of viral fitness relevant to pathogenicity. Previous work has shown that the IE1, but not the IE3, protein of mCMV transactivates RNR and TS gene promoters and has revealed an in vivo attenuation of the mutant virus mCMV-DeltaIE1. It was attractive to propose the hypothesis that lack of transactivation by IE1 and a resulting deficiency in the supply of dNTPs are the reasons for growth attenuation. Here, we have tested this hypothesis with the mutant virus mCMV-IE1-Y165C expressing an IE1 protein that selectively fails to transactivate RNR and TS in quiescent cells upon transfection while maintaining the capacity to disperse repressive nuclear domains (ND10). Our results confirm in vivo attenuation of mCMV-DeltaIE1, as indicated by a longer doubling time in host organs, whereas mCMV-IE1-Y165C replicated like mCMV-WT and the revertant virus mCMV-IE1-C165Y. Notably, the mutant virus transactivated RNR and TS upon infection of quiescent cells, thus indicating that IE1 is not the only viral transactivator involved. We conclude that transactivation of cellular genes of dNTP biosynthesis is ensured by redundancy and that attenuation of mCMV-DeltaIE1 results from the loss of other critical functions of IE1, with its function in the dispersal of ND10 being a promising candidate.


Figures

FIG. 1.
FIG. 1.
Identification of the mutation Y165C at the N-terminal proteasomal cleavage site of the antigenic IE1 peptide precursor. (A) Sequencing of the IE1 peptide-coding region of BAC plasmids. Sequencing was originally undertaken with the intention to verify codon CTT specifying Leu at the C-terminal MHC class I anchor position of the antigenic IE1 peptide in single-nucleotide-tagged IE1-A176L* revertants of the epitope deletion mutant IE1-L176A (76). This revealed an unintended surplus mutation of codon TAT into codon TGT, replacing Tyr with Cys at amino acid position 165 of the IE1 protein, which is position −3 relative to the N terminus of the antigenic IE1 peptide 168-YPHFMPTNL-176. (Top) HindIII physical map of the mCMV-WT.Smith genome (20, 63) with the MIE region shown expanded. Exons (Ex) are numbered. MIEPE, MIE promoter and enhancer. (Bottom) Sequencing of the region ranging from nucleotide (n)181,067 to n181,020 within exon 4/m123 on the complementary strand (C strand), drawn in twisted orientation. Signals from nucleotides A, T, G, and C are shown in green, red, black, and blue, respectively. Mutated amino acid positions and viruses are highlighted by red lettering, and WT and revertant amino acid positions and viruses are highlighted by green lettering. Amino acids within the region of interest (position −3 to position 9 relative to the N terminus of the antigenic IE1 peptide) are given in one-letter code. (B) Presentation of the naturally processed IE1 peptide on MEF infected under conditions of selective and enhanced IE gene expression (MOI, 4; cycloheximide was replaced after 3 h by actinomycin D) with the viruses indicated. n.i., uninfected MEF. Shown are data from a gamma interferon secretion-based ELISPOT assay using IE1 epitope-specific CTL as effector cells and the IE-phase-arrested infected MEF as stimulator cells. The filled circles represent data (spot counts per 100 IE1-CTL seeded) of triplicate assay cultures, and the bars represent the median values. Green labeling and red labeling indicate absence and presence of the mutation, respectively. P values (two-sided), determined by the distribution-free (nonparametric) Wilcoxon-Mann-Whitney rank sum test, are indicated.
FIG. 2.
FIG. 2.
Impact of the mutation Y165C on the transactivation of cellular genes involved in dNTP biosynthesis. (A) Transactivation of the RNR promoter PR2. (B) Transactivation of the TS promoter PTS. DLR assays were performed with growth-arrested NIH 3T3 cells transiently cotransfected with an IE1-encoding donor plasmid, the respective firefly luciferase-encoding reporter plasmid, and the Renilla luciferase-encoding plasmid pRL-TK for standardization of the transfection efficacy. Vector pUC19 was used as an empty donor plasmid for control. Plasmid maps (not drawn to scale) are illustrated. The donor plasmids were pIE100/1 (here referred to as pWT), specifying the authentic IE1 protein; pMut, specifying the mutated protein IE1-Y165C; and pRev, specifying the rescued protein IE1-C165Y. MIEPE, MIE promoter and enhancer; Ex, exon. The arrows indicate the direction of transcription; the arrowheads mark the location of the mutation in exon 4. Correct expression of the IE1 protein was inspected for all donor plasmids by IE1-specific immunofluorescence (not depicted). Luminescence data are expressed as RLU and are normalized for transfection efficacy by forming the quotient of firefly luciferase activity (RLUFL) and Renilla luciferase activity (RLURL). The solid circles and gray-shaded bars represent data from triplicate transfection cultures and their median value, respectively, for each experiment, with a total of three independent experiments performed for each type of donor plasmid tested. P values (two-sided), determined by the distribution-free (nonparametric) Wilcoxon-Mann-Whitney rank sum test (n1 = n2 = 9), are indicated.
FIG. 3.
FIG. 3.
Functions of mutated and rescued IE1 proteins. (A) Dispersion of nuclear domains (ND10). Shown are CLSM images of representative triple-labeled individual cells (MEF) infected for 4 h (corresponding to the E phase) at an MOI of 4 (0.2 PFU/cell × 20; centrifugal enhancement of infectivity for synchronization) with the IE1 deletion mutant mCMV-ΔIE1 (images a to d) or the point mutant mCMV-IE1-Y165C (images e to h). (a and e) Red staining of intranuclear viral proteins E1 (M112-M113) and IE1 (m123), respectively. Note that green Alexa Fluor 488 fluorescence was electronically converted into red for better contrast. (c and g) Green staining of PML protein. Note that red Alexa Fluor 546 fluorescence was electronically converted into green for better contrast. The arrow points to an intranuclear PML body/ND10. (b and f) Visualization of cell nuclei by blue staining of DNA with Hoechst 33342 dye. (d and h) Merge of red E1 or IE1 protein, green PML, and blue Hoechst dye staining. The bar marker represents 10 μm. (B) Quantification of intranuclear PML bodies. MEF were infected (see above) with the viruses indicated. For statistical-significance analysis, intranuclear PML bodies were counted for 30 infected cell nuclei per group. The dots represent the numbers of PML bodies in individual cell nuclei. The median values are marked by horizontal bars. Two-sided P values (Wilcoxon-Mann-Whitney rank sum test; n = 30) are indicated for group comparisons of major interest. (C) Time course of IE- and E-phase protein expression represented by proteins IE1 (pp89/76) and m164 (gp36.5), respectively. Shown are Western blots of MEF total lysate proteins isolated at the indicated time points after infection with the viruses shown below for lanes 1 to 4. n.i., not infected; lysate proteins derived from uninfected MEF.
FIG. 4.
FIG. 4.
Viral replicative fitness in quiescent fibroblasts in cell culture. MEF were growth arrested in low-serum starvation medium and were centrifugally infected at an MOI of 0.4 (0.02 PFU/cell × 20; centrifugal enhancement of infectivity) with the viruses indicated. (A) Quantitation of viral genomes in infected cells as determined by gene M55(gB)-specific real-time PCR with normalization to the cellular gene pthrp. (B) Quantitation of infectious virus released into the cell culture supernatant as determined by virus plaque assay. The data refer to 106 cells. Shown are the multistep growth curves for a period of 72 h postinfection (p.i.) corresponding to three viral growth cycles. Time zero is defined as the end of the 30-min period of centrifugal infection revealing the inoculum viral genomes and infectivity. The dots represent data from three six-well cultures for each of the time points indicated. The median values are marked by horizontal lines. The productivity after the first viral growth cycle is highlighted by gray shading, indicating the onset of viral-DNA replication after 16 h and virus release after 24 h, which is in perfect accordance with previous findings (39).
FIG. 5.
FIG. 5.
Transactivation of cellular genes of dNTP synthesis during infection of quiescent fibroblasts in cell culture. (A) Verification of growth arrest. MEF were cultured for 48 h either in regular cell culture medium (left) or in low-serum starvation medium (right), followed by immunofluorescence staining of the proliferation-associated nuclear antigen Ki-67 (Alexa Fluor 488 label; green fluorescence) and of F-actin (Texas red-conjugated phalloidin; red fluorescence). Shown are CLSM images of representative areas. The bar marker represents 20 μm. (B) Control for equivalence of infection. Growth-arrested MEF (see above) were infected for 6 h at an MOI of 4 with the viruses indicated, and E1 transcripts representing the E phase of viral-gene expression were determined by real-time RT-PCR. The data refer to 50 ng of total RNA, corresponding to ∼5,000 cells. n. i., uninfected MEF; UV, MEF exposed to UV light-inactivated mCMV-WT.BACUV at a dose corresponding to an MOI of 4; WT, MEF infected with mCMV-WT.BAC. The bars represent the median values of triplicate cultures. The error bars indicate the range. Green and red labeling of the bars highlights the absence and presence of mutations, respectively. (C) Relative quantitation of RNR and TS transcripts by real-time RT-PCR in MEF infected for 6 h, 12 h, and 24 h with the viruses indicated. Shown are expression levels (ΔΔCT values; see Materials and Methods) relative to GAPDH transcripts. The bars (filled bars, RNR; open bars, TS) represent the median values of triplicate cultures; the error bars indicate the range. Green and red labeling of the bars highlights the absence and presence of mutations, respectively.
FIG. 6.
FIG. 6.
Viral replicative fitness in host tissues. (A1) Immunocompromised BALB/c mice were infected with 105 PFU (corresponding to ∼5 × 10⁷ viral genomes) of the deletion mutant mCMV-ΔIE1 (images a1 to b2) or of the point mutant mCMV-IE1-Y165C (images c1 to d2). On day 10 after infection, liver tissue sections were analyzed by IHC staining of intranuclear IE1 protein (IE1-IHC, black) and of intranuclear MCP (MCP-IHC, red). The index 1 images (a1 to d1) provide overviews of section areas of ∼0.5 mm2. The arrows point to sites of interest that are resolved to greater detail in the corresponding index 2 (a2 to d2) images. The bar markers represent 50 μm. Note the absence of IE1 protein in the intranuclear inclusion bodies of hepatocytes infected with the deletion mutant mCMV-ΔIE1 (image a2). (A2) Quantitation of liver infection in the time course of viral spread. Plotted are semilogarithmic growth curves for the indicated viruses based on the numbers of infected, MCP+ liver cells counted in representative 10-mm2 liver tissue section areas. The solid circles represent data from individual mice, with the median values marked by horizontal lines. The DTs and their 95% confidence intervals (given in parentheses) are calculated from the slopes a (95% confidence intervals of a) of the calculated log-linear regression lines according to the following formula: DT = log 2/a. (B) DTs of the viral-DNA load in spleen and lungs. The numbers of viral genomes per 106 tissue cells were quantified by real-time PCR specific for the viral gene M55(gB) normalized to the cellular gene pthrp. For further explanation, see the legend to panel A2. p.i., postinfection.
FIG. 7.
FIG. 7.
In situ activation of cellular genes for dNTP synthesis during infection of the liver. Immunocompromised BALB/c mice were infected with 105 PFU of the viruses indicated. n. i. (not infected), uninfected but immunocompromised mice, showing that 6.5-Gy total-body gamma irradiation does not by itself stimulate the expression of genes involved in dNTP synthesis; UV, mice mock infected with UV light-inactivated mCMV-WT.BACUV in a dose corresponding to 105 PFU; WT, infectious mCMV-WT.BAC. The analysis was performed 10 days after infection. (A) Expression levels (ΔΔCT values) relative to GAPDH transcripts. The bars (solid bars, RNR; open bars, TS) represent the median values for three mice per experimental group; the error bars indicate the range. (B) Normalization of the relative expression levels of RNR to the numbers of E1 transcripts per 500 ng of total RNA (top) or to the numbers of infected MCP+ cells per defined liver tissue section area of 10 mm2 in order to take account of differences in tissue infection density. (C) Expression levels (ΔΔCT values) relative to β-actin in preparatively purified hepatocytes (Hc) and NPLCs derived from livers infected with mCMV-IE1-Y165C or from livers of a control group that was immunocompromised by total-body gamma irradiation but left uninfected. The section NPLC* shows the conservatively estimated contribution of contaminating NPLCs (10% in this experiment) to RNR and TS transcription in the hepatocyte fraction. The bars (solid bars, RNR; open bars, TS) represent the median values for three mice per experimental group; the error bars indicate the range. n. i., not infected.
FIG. 8.
FIG. 8.
Summarizing model of viral-DNA replication in quiescent cells. Activation of the TS and RNR gene promoters, PTS and PRNR, is a redundant function accomplished by the IE1 protein (green) and at least one unknown “factor X” (yellow), which could be a virus-encoded transactivator or a cellular transactivator triggered by the infection. The mutation Y165C (red) destroys the transactivator function of IE1 but does not affect the alternative transactivator, factor X. Activation of dNTP biosynthesis promotes viral replication in quiescent cells in cell culture and in host tissues. The cylindrical symbols represent promoters and structural genes, the wavy symbols represent mRNAs, and the oval symbols represent proteins.

References

    1. Adachi, N., and M. R. Lieber. 2002. Bidirectional gene organization: a common architectural feature of the human genome. Cell 109807-809. - PubMed
    1. Angulo, A., P. Ghazal, and M. Messerle. 2000. The major immediate-early gene ie3 of mouse cytomegalovirus is essential for viral growth. J. Virol. 7411129-11136. - PMC - PubMed
    1. Applied Biosystems. 2001. User bulletin no. 2: ABI Prism 7700 Sequence Detection System (manual no. 10/2001). Applied Biosystems, Foster City, CA.
    1. Ash, J., W.-C. Liao, Y. Ke, and L. F. Johnson. 1995. Regulation of mouse thymidylate synthase gene expression in growth-stimulated cells: upstream S phase control elements are indistinguishable from essential promoter elements. Nucleic Acids Res. 234649-4656. - PMC - PubMed
    1. Bain, M., M. Reeves, and J. Sinclair. 2006. Regulation of human cytomegalovirus gene expression by chromatin remodeling, p. 167-183. In M. J. Reddehase (ed.), Cytomegaloviruses: molecular biology and immunology. Caister Academic Press, Wymondham, Norfolk, United Kingdom.

Publication types

MeSH terms

LinkOut - more resources