. 2008 Oct;82(20):9978-93.
doi: 10.1128/JVI.01326-08. Epub 2008 Aug 6.

CD20, CD3, and CD40 ligand microclusters segregate three-dimensionally in vivo at B-cell-T-cell immunological synapses after viral immunity in primate brain

Affiliations

CD20, CD3, and CD40 ligand microclusters segregate three-dimensionally in vivo at B-cell-T-cell immunological synapses after viral immunity in primate brain

Carlos Barcia et al. J Virol. 2008 Oct.

Abstract

The clearance of virally infected cells from the brain is mediated by T cells that engage antigen-presenting cells to form supramolecular activation clusters at the immunological synapse. However, after clearance, the T cells persist at the infection site and remain activated locally. In the present work the long-term interactions of immune cells in brains of monkeys were imaged in situ 9 months after the viral inoculation. After viral immunity, the persistent infiltration of T cells and B cells was observed at the infection sites. T cells showed evidence of T-cell receptor signaling as a result of contacts with B cells. Three-dimensional analysis of B-cell-T-cell synapses showed clusters of CD3 in T cells and the segregation of CD20 in B cells, involving the recruitment of CD40 ligand at the interface. These results demonstrate that immunological synapses between B cells and T cells forming three-dimensional microclusters occur in vivo in the central nervous system and suggest that these interactions may be involved in the lymphocyte activation after viral immunity at the original infection site.


Figures

FIG. 1.
FIG. 1.
Infection of Ad-mCMV-βgal adenovirus induces expression of β-gal in monkey brain astrocytes and induces MHC molecule expression. (A) Schematic diagrams of the anatomical positions of stereotaxic microinjections of Ad-mCMV-βgal adenovirus performed in monkey brain. The left panel represents a view of macaque brain, where each colored circle represents a microinjection at assigned coordinates (red circles, right hemisphere; green circles, left hemisphere). The right panel represents a coronal section of the brain at one of the coordinates. The red line (right hemisphere) and green line (left hemisphere) represent the injection sites in the cortex. (B) β-Gal is expressed in astrocytes (GFAP-positive cells) but not in neurons (MAP-2-positive cells). Confocal pictures show two cells infected with Ad-mCMV-βgal adenoviral vector (expressing β-gal) combined with GFAP staining for astrocytes, MAP-2 staining for neurons, and DAPI for counterstaining. β-Gal-positive cells colocalize with GFAP staining but not with MAP-2 staining. Bar, 50 μm. (C) Seven days after Ad-mCMV-βgal infection, monkey brain sections show β-gal-positive cells, as seen by immunohistochemistry at the injection sites. Adjacent sections also showed HLA-DR expression by immunohistochemistry around the injection site. Left column, lower magnification (bar, 5 mm); right column, higher magnification (bar, 250 μm).
FIG. 2.
FIG. 2.
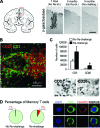
Nine months after viral infection, a high infiltration of lymphocytes persists at the injection sites. (A) Schematic diagram of a coronal macaque brain section. The red rectangle shows the anatomical area of the microinjections magnified on the right. Sections of monkey brain were stained for β-gal at 7 days and 9 months after intracranial adenoviral infection. The pictures show that 7 days after the injection, infected astrocytes (β-gal positive) can be seen by immunohistochemistry. However, 9 months after intracranial infection, the immune system has cleared infected cells in both rechallenged and non rechallenged animals. Bar: 1 mm. (B) The confocal picture shows infiltration of T cells (CD3+ cells in green) and B cells (CD20+ cells in red) through a blood vessel at the injection site of a monkey at 9 months after intracranial adenoviral infection. (C) The graph shows the stereological estimation of the number of T cells (CD3+ cells) and B cells (CD20+ cells) infiltrated in the brain parenchyma of monkeys infected intracranially with adenovirus (rechallenged or nonrechallenged). Rechallenged animals showed a higher number of infiltrated CD3+ T cells and a significant increase in their CD20+ B-cell population. Pictures of CD3+ and CD20+ cells in monkey brain parenchyma are also shown. (D) Quantification of CD3+/CD45RO+ T cells (memory T cells) and CD3+/CD45RO cells in rechallenged and nonrechallenged animals at the injection sites. Memory T cells (CD3+/CD45RO+) were more abundant in rechallenged animals. The pictures on the right show confocal pictures of the two cell types quantified (CD3+/CD45RO+ in the top row and CD3+/CD45RO in the bottom row).
FIG. 3.
FIG. 3.
CCL2 is expressed in the injection sites at 9 months after viral injection. Since T-cell infiltration was observed, we analyzed the expression of the chemokine CCL2 in the areas of infiltration by immunohistochemistry. (A) Schematic diagram of the anatomical localization of the stereotaxic microinjections of Ad-mCMV-βgal adenovirus in monkey brain. (B) Representative section of an injected cortex (a, a′, and a″) compared with a noninjected cortex (b, b′, and b″). The region indicated by the arrow is shown at higher magnification in panel a′, and a detail of CCL2-positive cells is shown in panel a″. All injection sites in both groups of animals showed CCL2 expression. No CCL2-positive cells were detected in noninjected areas. Bars: a and b, 2 mm; a′ and b′, 500 μm; a″ and b″, 150 μm.
FIG. 4.
FIG. 4.
Rechallenged animals show a higher percentage of T cells establishing synapses with B cells. Double immunofluorescence of CD3/CD11b, CD3/CD20, or CD20/CD11b in the brain sections was performed, and the proportion of cells engaged in synapses was quantified by confocal microscopy. The pictures show a representative example of each type of synapse quantified. The channels for the different staining, combined with DAPI as a counterstain, are shown in each row. The first row of images illustrates a CD3+ T cell engaged in synapse with a CD11b+ cell (microglia/macrophage). The second row shows a CD3+ T cell engaged in synapse with a CD20+ B cell, and the third row illustrates a B cell engaged in synapse with a CD11b+ cell (microglia/macrophage). The top pie graphs show the percentage of T cells engaged in synapses with B cells (red) or with microglia/macrophages (gray) in both nonrechallenged and rechallenged animals. The bottom pie graphs show the percentage of B cells synapsing with T cells (green) or with microglia/macrophages (gray). There was a significant increase in the number of CD3+ T cells establishing synapses with B cells in rechallenged monkeys compared with nonrechallenged animals (10% versus 2%). No differences were found in the rest of synapses quantified.
FIG. 5.
FIG. 5.
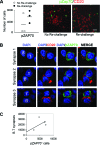
Activated T cells are present in monkey brain parenchyma at 9 months after intracranial infection and are found in contact with B cells. (A) Activated T cells (p-ZAP-70+ positive) were quantified at the injection sites 9 months after intracranial infection in both rechallenged and nonrechallenged animals. The graph shows that rechallenged animals normally have a larger population of p-ZAP-70-positive cells at the injection sites (although no statistically significant changes between the groups were observed). Bar, 50 μm. (B) Stainings of CD20 for B cells (red), p-ZAP-70 (green) for activated T cells, and DAPI (blue) (as counterstaining) were combined. Detailed confocal analysis showed p-ZAP-70-positive cells in contact with CD20+ B cells. The panels show three synapses between B cells and p-ZAP-70-positive T cells. Synapses 1 and 3 show some degree of polarization, with larger amounts of p-ZAP-70 at the cellular pole in contact with the B cell and very low p-ZAP-70 levels at the opposite pole. Synapse 2 displays p-ZAP-70 clustered at the center of the interface. In the three cases shown, p-ZAP-70 is somehow polarized toward the synapse interface. All three synapses were obtained from rechallenged animals. (C) Correlation between the number of activated T cells and the number of B-cell-T-cell synapses in each monkey 9 months after viral inoculation. The graph was generated by correlating the estimation of the number of activated T cells (expressing p-ZAP-70) on the x axis and the estimation of the total number of B-cell-T-cell synapses on the y axis. The number of B-cell-T-cell synapses was calculated from the stereological estimation of the total number of T cells multiplied by the estimated proportion of B-cell-T-cell synapses. The plot reveals a strong positive relationship between the number of T cells establishing synapses and activated T cells. The value of Pearson's correlation coefficient (r) is 0.75, and the P value is 0.02.
FIG. 6.
FIG. 6.
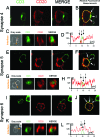
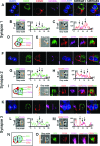
CD3 forms peripheral clusters at B-cell-T-cell immunological synapses, and CD20 is segregated peripherally. Detailed confocal analysis of immunological synapses between B cells (CD20+, in red) and T cells (CD3+, in green) in monkey brain sections was performed. The panels show immunological synapses between T cells and B cells. Fluorescence channels for CD3, CD20, and their merging are shown (A, E, and I). Relative fluorescence was measured along the CD20+ B-cell membrane and synapse interface, as depicted by yellow circular arrows (B, F, and J). The interface is indicated by arrows 1, 2, and 3 in the pictures and relative fluorescence graphs (D, H, and L). Results of the measurements are shown in the graphs. Three-dimensional reconstructions were performed at the interface level as indicated with the orange arrow on the gray scale image (C, G, and K). The reconstructions are shown in fluorescence channels for CD3, CD20, and merge. In all three synapses shown, higher CD20 relative fluorescence is seen at the periphery of the interface (indicated by arrows 1 and 3 in panels B, D, F, H, J, and L). At the center of the interface CD20 relative fluorescence levels were lower (indicated by arrows 2). In all three cases shown, three-dimensional reconstructions revealed that the CD20 molecule has a ring-shaped distribution at the interface. However, the relative fluorescence for CD3 in the three synapses reveals a pattern with maximum fluorescence in the peripheral area (indicated by arrows 1 and 3) and minimum fluorescence at the center of the interface (indicated by arrows 2). Three-dimensional reconstructions showed that CD3 forms a ring shape similar to that of CD20.
FIG. 7.
FIG. 7.
CD3 forms central clusters at B-cell-T-cell immunological synapses, and CD20 is segregated peripherally. Detailed confocal analysis of immunological synapses between B cells (CD20+, in red) and T cells (CD3+, in green) in monkey brain sections was performed. Panels show immunological synapses between T cells and B cells. Fluorescence channels for CD3, CD20, and their merging are shown (A, E, and I). Relative fluorescence was measured along the CD20+ B-cell membrane and synapse interface, as depicted by yellow circular arrows (B, F, and J). The interface is indicated by arrows 1, 2, and 3 in the pictures and relative fluorescence graphs (D, H, and L). Results of the measurements are shown in the graphs. Three-dimensional reconstructions were performed at the interface level as indicated with the orange arrow on the gray scale image (C, G, and K). The reconstructions are shown in fluorescence channels for CD3, CD20, and merge. In all three synapses shown, higher CD20 relative fluorescence is seen at the periphery of the interface (indicated by arrows 1 and 3 in panels B, D, F, H, J, and L). At the center of the interface, CD20 relative fluorescence levels were lower (indicated by arrows 2). In all three cases shown, three-dimensional reconstructions revealed that the CD20 molecule has a ring-shaped distribution at the interface. However, relative fluorescence for CD3 was maximum in the central area (indicated by arrows 2) and minimum at the periphery of the interface (indicated by arrows 1 and 2). Three-dimensional reconstructions revealed that CD3 forms a central cluster.
FIG. 8.
FIG. 8.
CD20 is segregated peripherally even if CD3 does not form clusters at B-cell-T-cell immunological synapses. The panels show immunological synapses between T cells and B cells. Fluorescence channels for CD3, CD20, and their merging are shown (A, E, and I). Relative fluorescence was measured along the CD20+ B-cell membrane and synapse interface, as is depicted by yellow circular arrows (B, F, and J). The interface is indicated by arrows 1, 2, and 3 in the pictures and relative fluorescence graphs (D, H, and L). Results of the measurements are shown in the graphs. Three-dimensional reconstructions were performed at the interface level as indicated with the orange arrow on the gray scale image (C, G, and K). The reconstructions are shown in fluorescence channels for CD3, CD20, and merge. In all three synapses shown, higher CD20 relative fluorescence was seen at the periphery of the interface (indicated by arrows 1 and 3 in panels B, D, F, H, J, and L). At the center of the interface, CD20 relative fluorescence levels were again lower (indicated by arrows 2). In all three cases shown, three-dimensional reconstructions revealed that the CD20 molecule has a ring-shaped distribution at the interface even if the relative fluorescence measurements and the three-dimensional reconstructions of CD3 did not reveal a well-defined arrangement at the synapse interface.
FIG. 9.
FIG. 9.
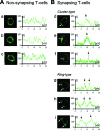
CD3 in T cells engaged in synapses with B cells polarizes to the synaptic interface. (A) Measurements of the relative fluorescence of CD3 along the membranes of T cells not engaged in synapses with B cells reveal an irregular pattern with no particular polarization. Three nonsynapsing T cells (a, b, and c) are shown. (B) Synapsing T cells (obtained from B-cell-T-cell synapses) with their relative fluorescence measurements. T cells in panels d, e, and f (cluster type) are T cells that show a central cluster of CD3, with the maximum of relative fluorescence at the center of the interface (arrows). T cells in panels g, h, and i (ring type) show segregation of CD3 to the peripheral area of the interface with two maxima of relative fluorescence at the periphery (arrows in panels g, h, and i). The T cells in panels d and e are also shown in Fig. 7. The T cell in panel f is also shown in Fig. 11. The T cells in panels h and i are also shown in Fig. 6.
FIG. 10.
FIG. 10.
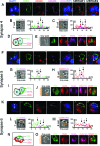
The CD40L recruited at the B-cell-T-cell immunological synapse forms a central cluster. B-cell-T-cell immunological synapses were analyzed in detail by confocal microscopy, combining CD20 (red), CD3 (green), CD40L (magenta) and DAPI (blue) as counterstaining. Three synapses are shown in detail. DAPI, CD3, CD20, and CD40L channels, as well as the merged channels CD40L/DAPI, merge 1 (CD3/CD20/CD40L), and merge 2 (CD3/CD20/CD40L/DAPI), are shown in panels A, F, and K. The relative fluorescence of each T-cell and B-cell forming synapses was measured along the membrane as is indicated in the gray scale images by circular arrows in panels B, G, and L for T cells and panels C, H, and M for B cells. The interface is indicated by arrows 1, 2, and 3. Measurements of relative fluorescence are shown in the graphs. Schematic representations of the synapses are depicted in panels D, I, and N. Three-dimensional reconstructions of the interface are shown in panels E, J, and O. In the three synapses studied, relative fluorescence of CD40L increases at the B-cell-T-cell interface (indicated between arrows 1 and 3). In these three cases, the highest relative fluorescence was observed at the center of the interface (arrows 2) and the lowest in the peripheral region (arrows 1 and 3). Three-dimensional reconstructions at the interface revealed that CD40L forms a central cluster surrounded by a CD20 ring.
FIG. 11.
FIG. 11.
CD40L can also be found segregated to the periphery of the interface. As in Fig. 10 and organized in the same way, three synapses are shown in detail. The fluorescence channels of each synapse are shown in panels A, F, and K. Relative fluorescence measurements revealed that CD40L is segregated to the periphery (panels B, G, and L for T cells and panels C, H, and M for B cells). Three-dimensional reconstructions revealed that CD40L appears to be segregated to the periphery, forming a ring-shaped cluster (E, J, and O). Schematic representations of the synapses are depicted in panels D, I, and N.
FIG. 12.
FIG. 12.
Confocal analysis of B-cell-T-cell synapses reveals some B cells where CD20 forms a central cluster. As in Fig. 10 and with a similar organization, two synapses are shown in detail. The fluorescence channels of each synapse are shown in panels A and F. Relative fluorescence measurements revealed that CD40L and CD20 are clustered at the center of the synapse (panels B and G for T cells and panels C and H for B cells). Three-dimensional reconstructions revealed that CD40L and CD20 appear to form central clusters (E and J). Schematic representations of the synapses are depicted in panels D and I.
FIG. 13.
FIG. 13.
Nonsynapsing T cells do not show a CD40L cluster, while nonsynapisng B cells do not show CD20 segregation. (A) Relative fluorescence measurements of CD40L in three nonsynapsing T cells show very low levels of fluorescence and no specific pattern of distribution. (B) Relative fluorescence measurements of CD20 in three nonsynapsing B cells do not show a specific pattern of distribution.
FIG. 14.
FIG. 14.
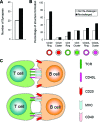
Rechallenging induces changes of the cluster formation in B-cell-T-cell synapses in vivo in monkey brain after viral immunity. (A) Quantification of the total number of synapses found and studied in detail in rechallenged and nonrechallenged animals. Rechallenged animals showed a higher number of synapses than nonrechallenged ones. (B) Percentages of B-cell-T-cell synapses forming different structures at the interface with respect to the total number of synapses studied. The percentage of cluster formation was higher for rechallenged animals in each case, except for the CD3 cluster. The formation of a CD20 ring was the most frequent structure at the interface, while a CD20 central cluster was very rare. (C) Two B-cell-T-cell synapses with the most frequent arrangements of the interface observed in the monkey brain in vivo after viral immunity. The top illustration depicts a B-cell-T-cell synapse forming a central cluster of CD3 and CD40L at the interface with segregation of CD20 to the periphery. The bottom illustration shows a B-cell-T-cell synapse forming a peripheral cluster (ring-like) of CD3 and CD40L with CD20 segregated toward the periphery.

References

    1. Allen, C. D., T. Okada, and J. G. Cyster. 2007. Germinal-center organization and cellular dynamics. Immunity 27190-202. - PMC - PubMed
    1. Allen, C. D., T. Okada, H. L. Tang, and J. G. Cyster. 2007. Imaging of germinal center selection events during affinity maturation. Science 315528-531. - PubMed
    1. Banchereau, J., F. Bazan, D. Blanchard, F. Briere, J. P. Galizzi, C. van Kooten, Y. J. Liu, F. Rousset, and S. Saeland. 1994. The CD40 antigen and its ligand. Annu. Rev. Immunol. 12881-922. - PubMed
    1. Barcia, C., M. Jimenez-Dalmaroni, K. M. Kroeger, M. Puntel, A. J. Rapaport, D. Larocque, G. D. King, S. A. Johnson, C. Liu, W. Xiong, M. Candolfi, S. Mondkar, P. Ng, D. Palmer, M. G. Castro, and P. R. Lowenstein. 2007. One-year expression from high-capacity adenoviral vectors in the brains of animals with pre-existing anti-adenoviral immunity: clinical implications. Mol. Ther. 152154-2163. - PMC - PubMed
    1. Barcia, C., A. Sanchez Bahillo, E. Fernandez-Villalba, V. Bautista, Y. P. M. Poza, A. Fernandez-Barreiro, E. C. Hirsch, and M. T. Herrero. 2004. Evidence of active microglia in substantia nigra pars compacta of Parkinsonian monkeys 1 year after MPTP exposure. Glia 46402-409. - PubMed

Publication types

MeSH terms