. 2008 Oct;295(4):F959-70.
doi: 10.1152/ajprenal.00559.2007. Epub 2008 Aug 6.

The molecular and functional phenotype of glomerular podocytes reveals key features of contractile smooth muscle cells

Affiliations

The molecular and functional phenotype of glomerular podocytes reveals key features of contractile smooth muscle cells

Moin A Saleem et al. Am J Physiol Renal Physiol. 2008 Oct.

Abstract

The glomerular podocyte is a highly specialized cell, with the ability to ultrafilter blood and support glomerular capillary pressures. However, little is known about either the genetic programs leading to this functionality or the final phenotype. We approached this question utilizing a human conditionally immortalized cell line, which differentiates from a proliferating epithelial phenotype to a differentiated form. We profiled gene expression during several time points during differentiation and grouped the regulated genes into major functional categories. A novel category of genes that was upregulated during differentiation was of smooth muscle-related molecules. We further examined the smooth muscle phenotype and showed that podocytes consistently express the differentiated smooth muscle markers smoothelin and calponin and the specific transcription factor myocardin, both in vitro and in vivo. The contractile contribution of the podocyte to the glomerular capillary is controversial. We demonstrated using two novel techniques that podocytes contract vigorously in vitro when differentiated and in real time were able to demonstrate that angiotensin II treatment decreases monolayer resistance, morphologically correlating with enhanced contractility. We conclude that the mature podocyte in vitro possesses functional apparatus of contractile smooth muscle cells, with potential implications for its in vivo ability to regulate glomerular dynamic and permeability characteristics.


Figures
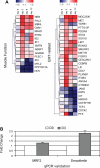
Fig. 1.
Fig. 1.
Microarray analysis and quantitative PCR (qPCR). A: identification and functional classification of regulated genes during podocyte differentiation. Cluster diagrams show expression profiles (based on median ratios normalized against baseline) of regulated genes in two related functional categories, representing 44 of 458 regulated genes. Color spectrum bars indicate upregulation (red) or downregulation (blue) with fold change of expression from −1.5 to +1.5. Gene name abbreviations correspond to Unigene nomenclature. B: quantitative PCR expression of smoothelin and MRF2. Time points analyzed were day 0 (proliferating cells at 33°C) and day 3 after thermoswitching. Day 0 (D0) shows a normalized median ratio of gene of interest expression to GAPDH expression, and day 3 (D3) indicates the fold change of expression compared with baseline (3 repeats). Error bars indicate SE.
Fig. 2.
Fig. 2.
Cellular immunofluorescence (all comparative images were taken at the same exposure; control IgG staining is shown at right). Smoothelin, myocardin, and calponin antibodies were raised in mouse, smooth muscle myosin, and α-smooth muscle actin (SMA) antibodies were raised in rabbit. A: smoothelin, showing faint filamentous expression in undifferentiated cells, and typical, strong filamentous distribution in differentiated cells. B: calponin. Faint, diffuse expression in undifferentiated cells; strong expression in differentiated cells in a pattern of actin stress fibers. C: α-SMA. Nuclear expression is nonspecific compared with negative control (not shown). Some cytoplasmic expression is seen and appears slightly stronger in differentiated cells. D: myosin heavy chain. No significant expression above negative control (not shown) in undifferentiated cells, with positive expression in differentiated cells. E: myocardin. No significant expression above control (not shown) in undifferentiated cells; strong nuclear and some cytoplasmic expression in differentiated cells. Magnification ×400.
Fig. 3.
Fig. 3.
Glomerular immunofluorescence. A: smoothelin (green). Left: linear, capillary loop pattern. Center: nephrin staining (red). Right: double immunostaining with nephrin demonstrating colocalization (yellow, arrow shows an example in a capillary loop). B: calponin (green). Left: linear, capillary loop pattern. Center: nephrin staining (red). Right: double immunostaining with nephrin demonstrating colocalization (yellow, arrow shows an example in a capillary loop). C: α-SMA (green). Left: mesangial cell pattern of distribution, with relatively weak podocyte staining. Center: double immunolabeling with nephrin to localize podocytes (red). Right: the same at higher magnification, demonstrating absence of colocalization. D: myosin heavy chain (green). Left: mesangial cell pattern of distribution, with relatively weak podocyte staining. Center: double immunolabeling with nephrin to localize podocytes (red). Right: the same at higher magnification, demonstrating absence of colocalization. E: myocardin (green). Left: nuclear cell staining. Center: WT-1 staining (a nuclear podocyte marker). Right: double staining with WT-1 colocalizing with myocardin (yellow). Magnification ×40 to ×100. Far right-hand column shows the level of expression of each protein in vascular smooth muscle in the same sections, illustrating greater level of expression compared with glomeruli. Where a glomerulus is present in the same panel, this is indicated by the solid arrow. Stippled arrows indicate blood vessels. For SMA (C), the inset is the same view as the main panel and shows the same artery, at lower fluorescence intensity.
Fig. 4.
Fig. 4.
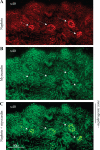
Expression of myocardin in developing newborn mouse glomeruli. A: nephrin. Showing expression of nephrin in mature glomeruli (stippled arrows) deep in the cortex (nephrin is expressed in postcapillary loop stage glomeruli), whereas more immature glomeruli in the subcapsular “nephrogenic zone” show no significant expression. B: myocardin. Definite expression is seen in only mature glomeruli. C: merged image, showing colocalization (yellow) in podocytes in the mature glomeruli.
Fig. 5.
Fig. 5.
Western blotting of smooth muscle proteins. A: SMA expression in differentiated (lane 1) podocytes. Positive and negative controls: stronger expression in a smooth muscle cell line (lane 2) and very weak expression in HK2 epithelial cells (lane 3). B: smoothelin. Indicates the predominantly visceral isoform of smoothelin (59 kDa) in colon control (lane 1); HK2 epithelial cell negative controls are shown in lane 2. Both contractile (110 kDa) and visceral isoforms seen in undifferentiated cells (lane 3). Differentiated cells show an upregulation of the contractile isoform, whereas the visceral isoform is unchanged (lane 4). C: myocardin. Colon positive control (lane 1); HK2 tubular epithelial cells negative control (lane 2); undifferentiated podocytes (lane 3); and differentiated podocytes, slightly greater expression (lane 4). D: calponin Western blot. Increased expression (34 kDa) in differentiated podocytes (lane 2) compared with undifferentiated podocytes (lane 1); glomerular extract (glom; lane 3) colon positive control (cont; lane 4), and very weak expression in HK2 cells (lane 5).
Fig. 6.
Fig. 6.
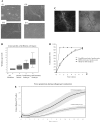
Collagen matrix contraction assay. A: single cell contractility after 4 h on substrate; appearance of wrinkles on substrate indicates cell contraction: (i) undifferentiated NIH3T3 fibroblasts, no wrinkles; (ii) undifferentiated podocytes showing few, short wrinkles; (iii) differentiated podocytes showing multiple deep, long wrinkles on silicon elastomer; (iv) rat aortic smooth muscle control, multiple deep wrinkles. B: graphs showing single-cell contractility measured by counts of substrate wrinkles per cell. Bars show median, interquartile range, and highest and lowest values. Statistical analysis used the Kruskal-Wallis test. *P < 0.05. C: gel contraction assay. Representative confocal reflection image of gel (left) and differential interference contrast (DIC) image (right) of undifferentiated cell on day 3 after seeding. Note the alignment of the matrix toward the cell (also visible in the DIC image). D: gel contraction assay. Cell contraction measured by percentage of gel area. Undifferentiated podocytes contract 3D collagen gels over 7 days down to ∼20% of the original gel area. Differentiated podocytes have much more vigorous contractile properties, reaching maximal contraction within the first 24 h after seeding in the gel. Control NIH3T3 fibroblasts show similar contraction kinetics as undifferentiated podocytes (error bars indicate mean contraction percentage at each time point ± SE). E: gel contraction assay. Force generation during matrix contraction. Undifferentiated and differentiated podocytes were seeded in collagen matrixes at a density of 3.3 × 10⁶ and 1 × 10⁶ cells/ml, respectively, and placed on the culture force monitor system. Force associated with matrix contraction was recorded every second for ∼15 h. The graph shows the baseline-corrected mean force generated by 106 cells for each cell type. Values shown are means and SE from 4 experiments.
Fig. 7.
Fig. 7.
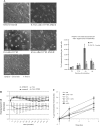
Podocyte contractility in response to angiotensin (Ang) II on differentiated podocytes. A: morphological changes in podocytes by light microscopy at several time points after stimulation with Ang II, and blocking of contraction changes by losartan (Los). Graph shows quantification of contracted cells by blinded counting (3 independent experiments; error bars indicate means ± SE). B: electrical cell-substrate impedance sensing (ECIS). Time course measurement of resistance of differentiated podocytes after Ang II stimulation, and blocking of effect by losartan. Error bars indicate means ± SE. C: angiotensin stimulates cell-mediated gel contraction by differentiated podocytes. Differentiated podocytes were embedded in collagen gels in cell-free medium and starved for 2 h prior to stimulation with Ang II. AT1 inhibitor losartan and ATII inhibitor PD123319 (PD) were added to the medium 30 min prior to stimulation. Shown are means ± SE for 3 experiments done in triplicate for losartan and twice for PD123319. There is no statistical difference between the values of the medium alone (SF) and all others except Ang II (Ang; P = 0.01). Significant difference between Ang II (2 and 7 h) and Ang II + PD (P = 0.003) or Ang II + Los (P = 0.01, Student's t-test).

References

    1. Allt G, Lawrenson JG. Pericytes: cell biology and pathology. Cells Tissues Organs 169: 1–11, 2001. - PubMed
    1. Andrews PM, Coffey AK. Cytoplasmic contractile elements in glomerular cells. Fed Proc 42: 3046–3052, 1983. - PubMed
    1. Bandopadhyay R, Orte C, Lawrenson JG, Reid AR, De Silva S, Allt G. Contractile proteins in pericytes at the blood-brain and blood-retinal barriers. J Neurocytol 30: 35–44, 2001. - PubMed
    1. Boute N, Gribouval O, Roselli S, Benessy F, Lee H, Fuchshuber A, Dahan K, Gubler MC, Niaudet P, Antignac C. NPHS2, encoding the glomerular protein podocin, is mutated in autosomal recessive steroid-resistant nephrotic syndrome. Nat Genet 24: 349–354, 2000. - PubMed
    1. Brenner BM, Troy JL, Daugharty TM. The dynamics of glomerular ultrafiltration in the rat. J Clin Invest 50: 1776–1780, 1971. - PMC - PubMed

Publication types

MeSH terms

LinkOut - more resources