. 2008 Aug 15;181(4):2544-55.
doi: 10.4049/jimmunol.181.4.2544.

CD46-induced immunomodulatory CD4+ T cells express the adhesion molecule and chemokine receptor pattern of intestinal T cells

Affiliations

CD46-induced immunomodulatory CD4+ T cells express the adhesion molecule and chemokine receptor pattern of intestinal T cells

Shannon K Alford et al. J Immunol. .

Abstract

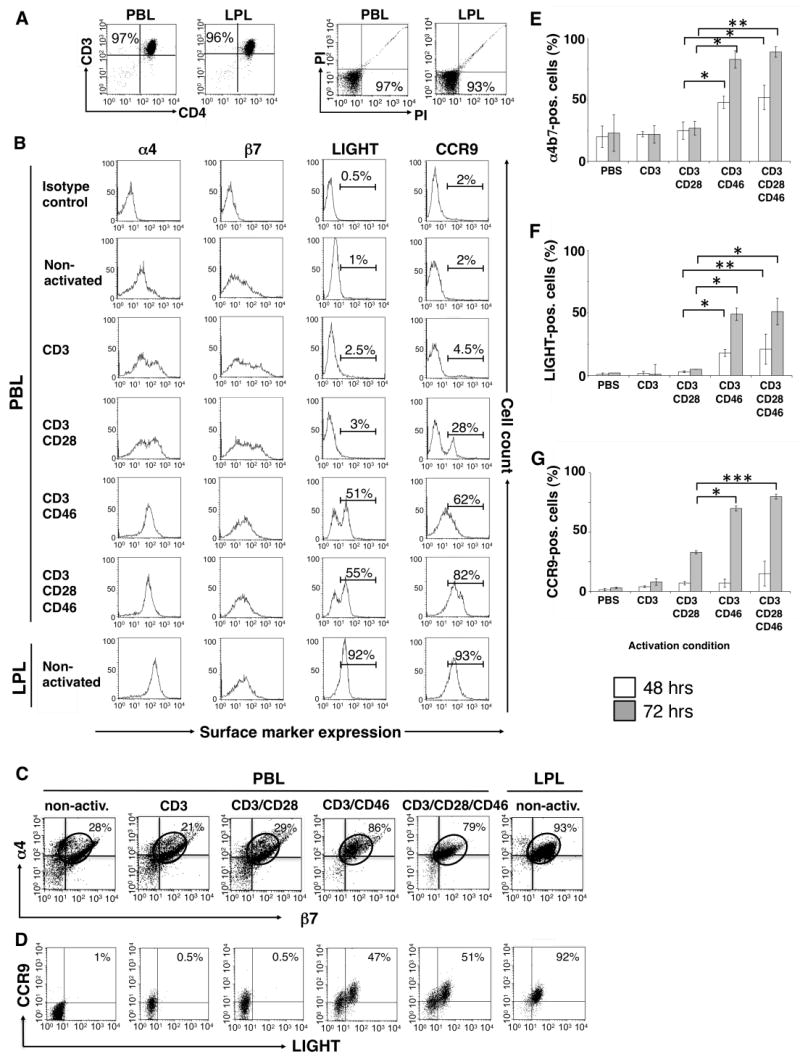
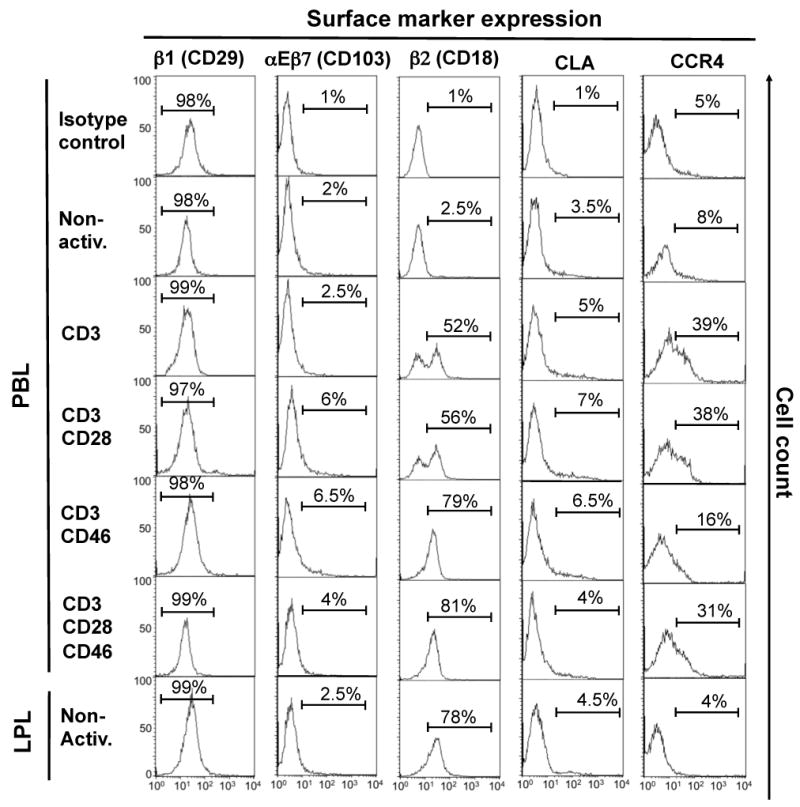
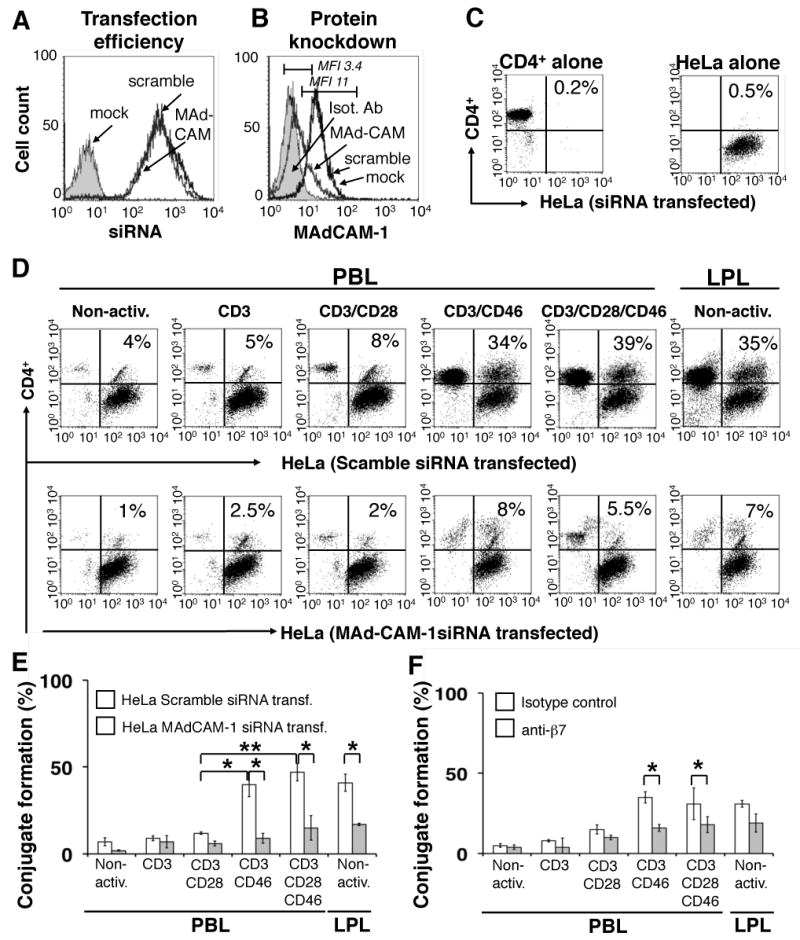
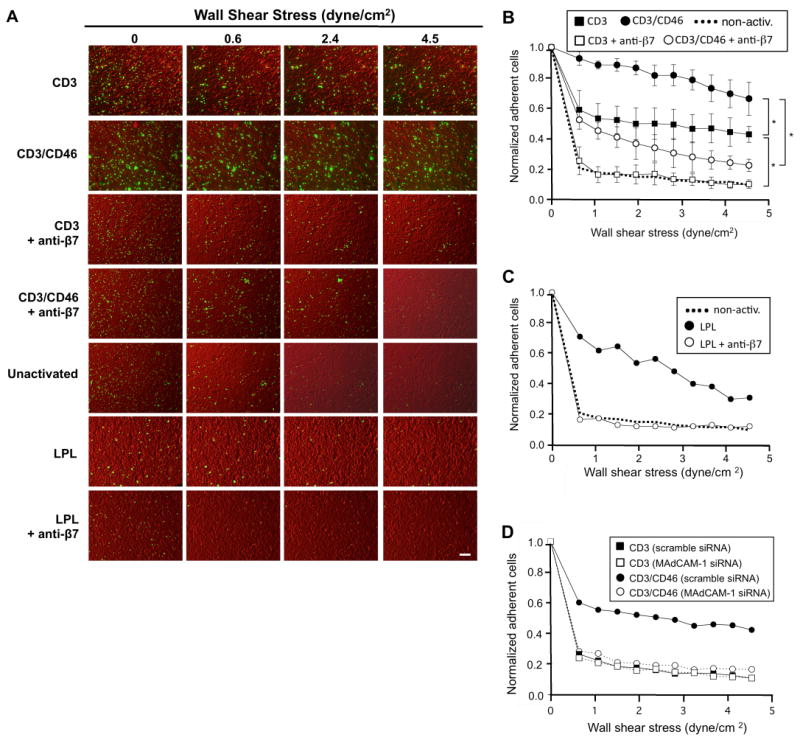
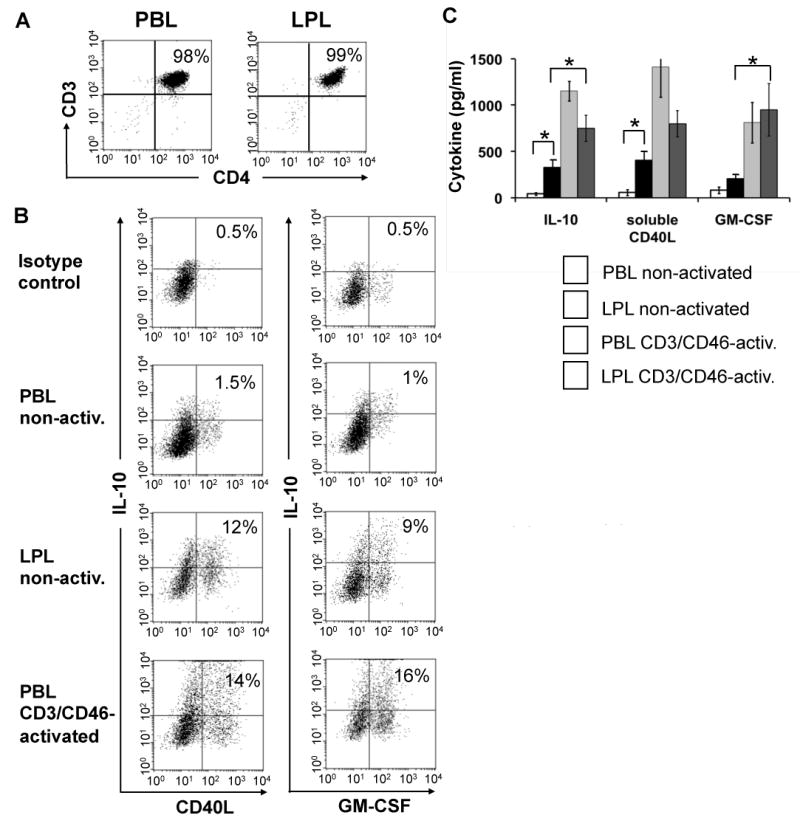
Tissue homing of activated T cells is typically mediated through their specific integrin and chemokine receptor repertoire. Activation of human primary CD4(+) T cells in the presence of CD46 cross-linking induces the development of a distinct immunomodulatory T cell population characterized by high IL-10/granzyme B production. How these regulatory T cells (Tregs) migrate/home to specific tissue sites is not understood. In this study, we determined the adhesion protein and chemokine receptor expression pattern on human CD3/CD46-activated peripheral blood CD4(+) T cells. CD3/CD46-activated, but not CD3/CD28-activated, T cells up-regulate the integrin alpha(4)beta(7). The interaction of alpha(4)beta(7) with its ligand mucosal addressin cell adhesion molecule 1 (MAdCAM-1) mediates homing or retention of T cells to the intestine. CD3/CD46-activated Tregs adhere to/roll on MAdCAM-1-expressing HeLa cells, similar to T cells isolated from the human lamina propria (LP). This interaction is inhibited by silencing MAdCAM-1 expression in HeLa cells or by the addition of blocking Abs to beta(7). CD46 activation of T cells also induced the expression of the surface-bound cytokine LIGHT and the chemokine receptor CCR9, both marker constitutively expressed by gut LP-resident T cells. In addition, we found that approximately 10% of the CD4(+) T lymphocytes isolated from the LP of patients undergoing bariatric surgery contain T cells that spontaneously secrete a cytokine pattern consistent with that from CD46-activated T cells. These data suggest that CD46-induced Tregs might play a role in intestinal immune homeostasis where they could dampen unwanted effector T cell responses through local IL-10/granzyme B production.


Conflict of interest statement

Conflict-of-interest disclosure: The authors declare no competing financial interests.

Figures

Figure 1
Figure 1
CD3/CD46-activated T cells express α4β7, LIGHT and CCR9. Purified peripheral blood CD4+ T cells (PBL) were activated with the indicated immobilized mAbs and cell samples were analyzed after 48 and 72 hrs via FACS for the expression of α4β7, LIGHT and CCR9. For the expression analysis of CCR9, cells were incubated in media containing 10 nM all-trans-retinoic acid. Freshly isolated non-activated lamina propria lymphocytes (LPL) were used as positive control in all experiments. (A) One representative FACS analysis depicting the purity and viability of the isolated PBL and LPL CD4+ subpopulations. (B) Single stain analysis of α4, β7, LIGHT and CCR9 expression at 72 hrs post activation and double stain analysis for (C) α4 and β7 or (D) LIGHT and CCR9 expression of PBL and LPL 72 hrs post activation/isolation. Shown is one representative FACS analysis of three similarly performed experiments for each double staining. (E to G) Statistical analysis of three similarly performed experiments. Data shown represent integrin/LIGHT/CCR9 expression (mean ± SD) of three separate experiments. Statistical difference in α4β7, LIGHT and CCR9 expression between analyzed lymphocyte subpopulations was determined using the paired Student's t test.
Figure 2
Figure 2
CD3/CD46-activated, α4β7-expressing T cells form conjugates with MAdCAM-1-expressing HeLa cells but not with HeLa cells in which MAd-CAM-1 expression had been silenced. (A) siRNA transfection efficiency of HeLa cells. HeLa cells were transfected with either Cy3-labeled siRNA targeting MAd-CAM-1, negative control scramble siRNA or buffer (mock, shaded histrogram) and transfection efficiency determined via FACS 24 hrs post transfection. (B) Analysis of MAd-CAM-1 protein expression/knockdown post siRNA transfection. HeLa cells were transfected with the indicated siRNAs and MAd-CAM-1 expression analyzed 24 hrs later via FACS. The shaded histrogram shows staining with an isotype control Ab. (C and D) CD3/CD46-activated CD4+ PBL form increased numbers of conjugates with MAd-CAM-1-expressing HeLa cells. HeLa cells were transfected with Cy3-labeled control scramble siRNA or MAd-CAM-1 siRNA, grown to confluence in culture plates and incubated with CFSE-labeled PBL that had been activated for 72 hrs under the depicted activation conditions. Non-attached cells were removed, remaining cells detached and analyzed by FACS analysis for the amount of retained PBL and HeLa/PBL conjugates. Freshly isolated LPL were used as positive control and non-activated PBL as negative control. Shown is one representative FACS analysis of three similarly performed experiments. (E) Statistical analysis of three separate experiments performed as described under ‘C’ (mean ± SD). (F) The addition of an anti-β7 antibody decreases binding of CD3/CD46-activated PBL and LPL to HeLa cells. Experiments were performed as described under ‘C’ using the control siRNA transfected HeLa cells but with the addition of a blocking anti-β7 antibody. Shown is the statistical analysis of β7-mediated blocking of the PBL or LPL/HeLa interaction of three separate experiments (mean ± SD). Statistical differences in panels ‘D’ and ‘E’ were determined using the paired Student's t test.
Figure 3
Figure 3
Analysis of the adherence properties of CD3/CD46-activated T cells mediated by the α4β7/MAdCAM-1 interaction using a parallel plate flow chamber assay. (A) Microscopical comparison of adherence behavior between differently activated PBL and freshly isolated LPL. CD3 or CD3/CD46-activated CD4+ PBL or non-activated LPL were CSFE-labeled, injected into the flow chamber containing a monolayer of HeLa cells and incubated for 15 min prior to the start of flow. Time-lapse microscopy was used to record differential interference contrast (DIC) and fluorescent images of adherent T-cells as the flow rate of the medium was increased. Representative DIC/CFSE-merged images are shown for indicated wall shear stress levels. Bar is equal to 150 μm. (B) CD3/CD46-activated T cells adhere strongly to HeLa cells and this interaction is significantly decreased by pre-incubation with an anti-β7 antibody. Experiments were performed as described under ‘A’. At depicted wall shear stress levels, the number of adherent cells was assessed. Shown is the statistical analysis of β7-mediated blocking of the PBL/HeLa interaction of three separate experiments (mean ± SD). *Statistical difference in adherence between CD3 and CD3/CD46-activated T cells and between cell populations with and without Ab addition was p < 0.05 in all cases as determined by ANOVA using the Student-Newman Keuls post-hoc test. (C) LPL display similar adherence behavior as CD3/CD46 activated T cells. Experiments were performed as described under ‘A’ and the number of adherent LPL plotted against the wall shear stress as described under ‘B’. Shown is the result of one experiment. (D) siRNA knockdown of MAd-CAM-1 expression in HeLa cells abrogates adherence of CD3/CD46-activated T cells. HeLa cells were transfected with either control scramble siRNA or MAd-CAM-1 siRNA. Flow experiments were then performed as described under ‘A’ using CD3 or CD3/CD46-activated T cells and analyzed as described under ‘B’. Shown is the result of one experiment.
Figure 4
Figure 4
CD3/CD46-activated peripheral blood CD4+ T cells produce a cytokine pattern similar to that of lamina propria-derived T cells. (A) CD4+ T cells were isolated from blood or the lamina propria and analyzed for purity via FACS analysis. (B) Comparison of the simultaneous IL-10/CD40L and IL-10/GM-CSF production by resting and CD3/CD46-activated PBL with freshly isolated LPL. Purified PBL and LPL were cultured for 24 hrs in IL-2-containing media in the presence of monensin (last 12 hrs of culture) and cytokine expression determined by intracellular double staining and FACS analysis. CD3/CD46-activated PBL are shown for comparison. Depicted is one representative FACS analysis of three similarly performed experiments. (C). LPL respond normally to CD3/CD46-activation. Freshly isolated PBL and LPL were cultured for 36 hrs w/o activation or with CD3/CD46 activation and cytokine production measured by ELISA. Activation of PBL and LPL with an anti-CD3 Ab alone did not lead to a significant increase in cytokine production (not shown). Statistical difference in cytokine production by differently activated PBL and LPL was determined using the paired Student's t test.
Figure 5
Figure 5

References

    1. Van Parijs A, Abbas AK. Homeostasis and self-tolerance in the immune system: turning lymphocytes off. Science. 1998;280:243–248. - PubMed
    1. Bluestone JA, Abbas AK. Natural versus adapative regulatory T-cells. Nat Rev Immunol. 2003;3:253–257. - PubMed
    1. Sakaguchi S. Regulatory T-cells: key controllers of immunologic self-tolerance. Cell. 2000;101:455–458. - PubMed
    1. Shevach EM. Regulatory T-cells in autoimmunity. Annu Rev Immunol. 2000;18:423–449. - PubMed
    1. Jonuleit H, Schmitt E. The regulatory T-cell family: distinct subsets and their interrelations. J Immunol. 2003;171:6323–6327. - PubMed

Publication types

MeSH terms