. 2008 Oct;148(2):719-29.
doi: 10.1104/pp.108.126789. Epub 2008 Aug 6.

Generation of hydrogen peroxide in chloroplasts of Arabidopsis overexpressing glycolate oxidase as an inducible system to study oxidative stress

Affiliations

Generation of hydrogen peroxide in chloroplasts of Arabidopsis overexpressing glycolate oxidase as an inducible system to study oxidative stress

Holger Fahnenstich et al. Plant Physiol. 2008 Oct.

Abstract

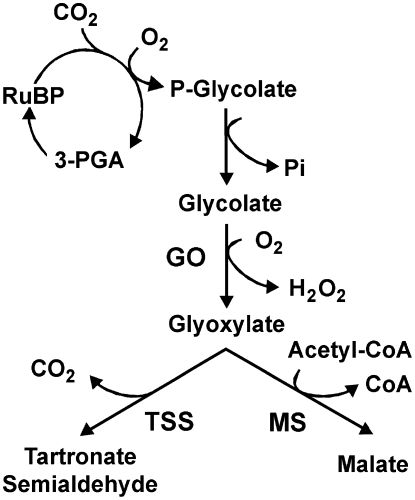
Arabidopsis (Arabidopsis thaliana) overexpressing glycolate oxidase (GO) in chloroplasts accumulates both hydrogen peroxide (H(2)O(2)) and glyoxylate. GO-overexpressing lines (GO plants) grown at 75 micromol quanta m(-2) s(-1) show retarded development, yellowish rosettes, and impaired photosynthetic performance, while at 30 micromol quanta m(-2) s(-1), this phenotype virtually disappears. The GO plants develop oxidative stress lesions under photorespiratory conditions but grow like wild-type plants under nonphotorespiratory conditions. GO plants coexpressing enzymes that further metabolize glyoxylate but still accumulate H(2)O(2) show all features of the GO phenotype, indicating that H(2)O(2) is responsible for the GO phenotype. The GO plants can complete their life cycle, showing that they are able to adapt to the stress conditions imposed by the accumulation of H(2)O(2) during the light period. Moreover, the data demonstrate that a response to oxidative stress is installed, with increased expression and/or activity of known oxidative stress-responsive components. Hence, the GO plants are an ideal noninvasive model system in which to study the effects of H(2)O(2) directly in the chloroplasts, because H(2)O(2) accumulation is inducible and sustained perturbations can reproducibly be provoked by exposing the plants to different ambient conditions.


Figures

Figure 1.
Figure 1.
Metabolic generation of H2O2 in chloroplasts through the action of GO. The further metabolization of glyoxylate by TSS or MS is also shown. 3-PGA, 3-Phosphoglycerate.
Figure 2.
Figure 2.
Enzymatic activities in leaves of transgenic and wild-type (wt) plants. A and B, GO (A) and MS (B) activities. The values presented are means ± se of at least eight plants in each case. All transgenic lines showed significant differences from wild-type values calculated by Student's t test (P < 0.05). C, The presence of the TSS protein in TSS and GO-TSS lines is confirmed by western-blot analysis using specific antibodies. Ec, E. coli extract expressing recombinant TSS.
Figure 3.
Figure 3.
Phenotypes of GO, GO-TSS, and GO-MS lines. A, Rosette phenotypes of plants grown at ambient atmospheric CO2 concentration (380 μL L−1) in different light conditions. wt, Wild type; μE, μmol quanta m−2 s−1. B, Glyoxylate content in leaf extracts of transgenic and wild-type plants. FW, Fresh weight. C, DAB staining of transgenic and wild-type leaves to assess H2O2 accumulation. Plants were grown for 14 d at 75 μmol quanta m−2 s−1 and transferred for 10 d to 200 μmol quanta m−2 s−1 during the light period. Brown deposits under bright-field illumination indicate the presence of H2O2 in all lines expressing GO.
Figure 4.
Figure 4.
Growth and photosynthetic parameters of the GO lines. A and B, Rosette diameter (A) and flowering time (B) of plants grown at 75 μmol quanta m−2 s−1 and at ambient atmospheric CO2 concentration (380 μL L−1). C, ETR of plants grown for 35 d at 75 μmol quanta m−2 s−1 and at ambient atmospheric CO2 concentration (380 μL L−1). D, ETR of plants grown for 14 d at 75 μmol quanta m−2 s−1 and at ambient atmospheric CO2 concentration (380 μL L−1) and then transferred to 4,000 μL L−1 CO2 for 21 d. The values presented in A, C, and D are means ± se of at least eight plants each. The values presented in B were obtained by counting the number of bolted plants (70 plants per line in total) at the end of each week. Asterisks indicate significant differences from wild-type (wt) values calculated by Student's t test (P < 0.05). A representative experiment from two biological replicates is presented in each case.
Figure 5.
Figure 5.
Accumulation of starch in leaves of transgenic and wild-type (wt) plants. A, Plants were grown for 42 d at 75 μmol quanta m−2 s−1 and at a CO2 concentration of 380 μL L−1. B, Plants were grown for 35 d at 75 μmol quanta m−2 s−1 and at a CO2 concentration of 380 μL L−1 and then transferred for 7 d to 600 μmol quanta m−2 s−1. C, Plants were grown for 42 d at 75 μmol quanta m−2 s−1 and at a CO2 concentration of 4,000 μL L−1. In all cases, plants were assayed for starch content using iodine staining 6 h after the onset of the light period. μE, μmol quanta m−2 s−1.
Figure 6.
Figure 6.
Analysis of antioxidant enzyme activities in wild-type (wt) and GO5 plants. A and B, APX (A) and CAT (B) activity quantification of leaf extracts from 21-d-old plants grown at 75 μmol quanta m−2 s−1 or exposed for 6 h to 200 μmol quanta m−2 s−1. Plants were grown under ambient atmospheric CO2 concentration (380 μL L−1). The values presented are means ± se of over three replicate experiments. Significant differences in the mean values from the wild type according to the Student's t test are indicated with asterisks (P < 0.05). μE, μmol quanta m−2 s−1. C, In gel test for SOD activity using 15 μg of total protein leaf extract from wild-type and GO5 plants grown at 75 μmol quanta m−2 s−1. chl, Chloroplastic; cyt, cytosolic.
Figure 7.
Figure 7.
Responses of wild-type (wt) and GO lines to high light treatment. A and B, Phenotypes of the wild-type and GO plants (A) and quantification of the anthocyanin levels (expressed as corrected A535 per milligram fresh weight) at different times during growth at 600 μmol quanta m−2 s−1 and ambient CO2 concentration (380 μL L−1; B). The values are means ± se of three measurements of at least six plants each. FW, Fresh weight. C, Semiquantitative RT-PCR analysis of PAL1, CHS, and DFR transcript levels in leaves of wild-type, GO, and GO-MS plants after 6 h of high light exposure. PCR products of 251 bp (PAL1), 448 bp (CHS), and 450 bp (DFR) were amplified using 33 cycles. As a loading control, a 521-bp ACTIN2 cDNA fragment was amplified using 29 cycles.
Figure 8.
Figure 8.
Responses of GO, GO-MS, and MS plants to high light treatment. Changes in the expression levels of selected H2O2-induced markers were analyzed by quantitative RT-PCR in 21-d-old plants grown under 75 μmol quanta m−2 s−1 (moderate light [ML]) and at ambient atmospheric CO2 concentration (380 μL L−1) and exposed for 6 h to 600 μmol quanta m−2 s−1 (high light [HL]) relative to control plants kept at 75 μmol quanta m−2 s−1. Data are means ± se of three individual experiments run in triplicate. Asterisks indicate that values are significantly different from those of the control MS plants as determined by Student's t test (P < 0.05).

References

    1. Apel K, Hirt H (2004) Reactive oxygen species: metabolism, oxidative stress, and signal transduction. Annu Rev Plant Biol 55 373–399 - PubMed
    1. Asada K (1999) The water-water cycle in chloroplasts: scavenging of active oxygen and dissipation of excess photons. Annu Rev Plant Physiol Plant Mol Biol 50 601–659 - PubMed
    1. Asada K (2006) Production and scavenging of reactive oxygen species in chloroplasts and their function. Plant Physiol 141 391–396 - PMC - PubMed
    1. Baxter CJ, Redestig H, Schauer N, Repsilber D, Patil KR, Nielsen J, Selbig J, Liu J, Fernie AR, Sweetlove LJ (2007) The metabolic response of heterotrophic Arabidopsis cells to oxidative stress. Plant Physiol 143 312–325 - PMC - PubMed
    1. Beauchamp C, Fridovich I (1971) Superoxide dismutase: improved assays and an assay applicable to acrylamide gels. Anal Biochem 44 276–287 - PubMed

Publication types

MeSH terms

LinkOut - more resources