. 2008 Aug 12;105(32):11287-92.
doi: 10.1073/pnas.0801631105. Epub 2008 Aug 6.

Diverse cytokine production by NKT cell subsets and identification of an IL-17-producing CD4-NK1.1- NKT cell population

Affiliations

Diverse cytokine production by NKT cell subsets and identification of an IL-17-producing CD4-NK1.1- NKT cell population

Jonathan M Coquet et al. Proc Natl Acad Sci U S A. .

Abstract

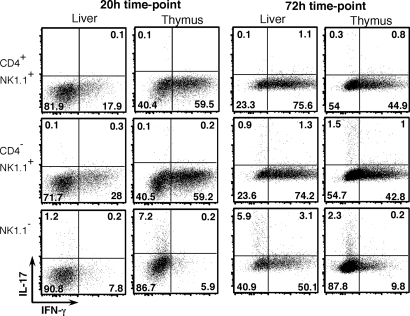
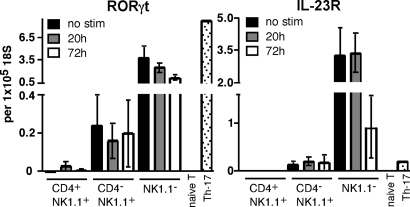
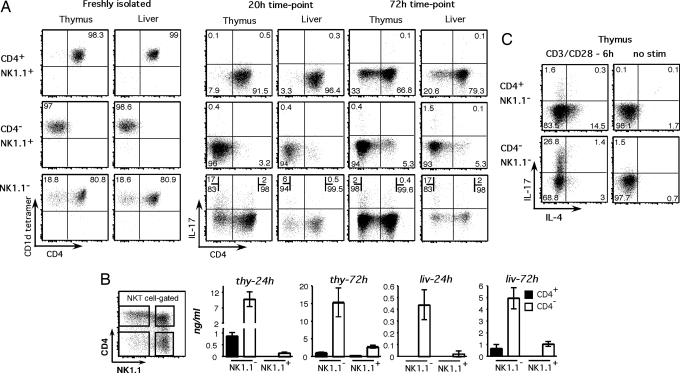
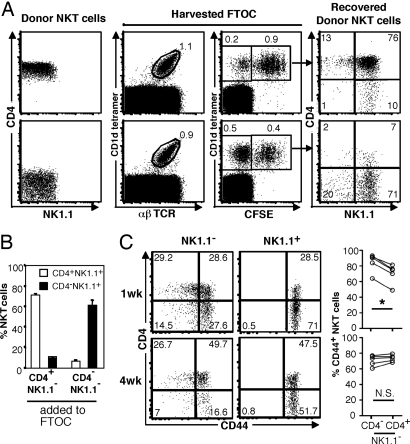
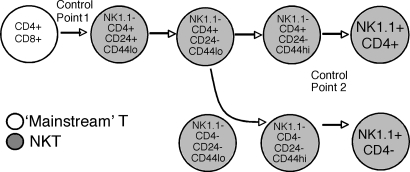
NKT cell subsets can be divided based on CD4 and NK1.1 expression and tissue of origin, but the developmental and functional relationships between the different subsets still are poorly understood. A comprehensive study of 19 cytokines across different NKT cell subsets revealed that no two NKT subpopulations exhibited the same cytokine profile, and, remarkably, the amounts of each cytokine produced varied by up to 100-fold or more among subsets. This study also revealed the existence of a population of CD4(-)NK1.1(-) NKT cells that produce high levels of the proinflammatory cytokine IL-17 within 2-3 h of activation. On intrathymic transfer these cells develop into mature CD4(-)NK1.1(+) but not into CD4(+)NK1.1(+) NKT cells, indicating that CD4(-)NK1.1(-) NKT cells include an IL-17-producing subpopulation, and also mark the elusive branch point for CD4(+) and CD4(-) NKT cell sublineages.


Conflict of interest statement

The authors declare no conflict of interest.

Figures

Fig. 1.
Fig. 1.
Distinct cytokine production by NKT cell subsets. NKT cells from spleens, livers, and thymuses of B6 mice were identified as α-GC/CD1d tetramer+ αβTCR+ cells and divided further on the basis of NK1.1 and CD4 expression as shown in the upper right dot plot (shown is a representative thymus sample). Purified NKT subsets were cultured in wells coated overnight with 10 μg/ml anti-CD3 and 10 μg/ml anti-CD28. An aliquot of supernatant was harvested at 24 and 72 h to assay for secreted cytokines. IL-17 and IL-21 were assayed by ELISA. All other cytokines were assayed by cytometric bead array. The absence of bars indicates undetectable amounts of cytokine, unless “not done” is stated. For thymus and liver NKT subsets, the results are derived from 5 or 6 separate cultures collected over three independent experiments. For spleen NKT cell subsets, results are derived from 3 or 4 separate cultures collected over two independent experiments. Bars depict mean ± standard error. All cytokine values are expressed in ng/ml. Total cells = absolute cell number.
Fig. 2.
Fig. 2.
Costaining of NKT cell subsets for IFN-γ and IL-17. NKT cell subsets were isolated and stimulated on anti-CD3– and anti-CD28–coated plates as described in Fig. 1. GolgiStopTM was added to cultures 4 h before the indicated time point, and cells were stained for intracellular IFN-γ-APC and IL-17-PE. Numbers in each quadrant represent the percentage of cells in that quadrant, and results are representative of two independent experiments.
Fig. 3.
Fig. 3.
Constitutive expression of RORγt and IL-23R by NK1.1 NKT cells. NKT cells were isolated from thymuses of B6 mice, separated into CD4+NK1.1+, CD4NK1.1+, and NK1.1 fractions, and stimulated for 20 or 72 h on anti-CD3/CD28–coated plates as in Fig. 1. Naïve T cells (CD4+/CD62L+/CD44lo/CD25) also were purified from spleen, and Th-17 cells were generated from naïve spleen after 3-d culture on anti-CD3–coated plates in the presence of TGF-β, IL-6, anti-IFN-γ, anti-IL-4, and 1 μg/ml soluble anti-CD28. RNA was isolated from all cell preparations, and expression of RORγt and IL-23R was determined relative to 18S ribosomal RNA. No stimulation and 20-h bars represent a total of 2 or 3 separate samples collected over two independent experiments, and 72-h bars represent 4–6 separate samples collected over three independent experiments. Bars depict mean ± standard error.
Fig. 4.
Fig. 4.
IL-17 is produced primarily by a rare population of NK1.1CD4 NKT cells. (A) Purified NKT cell populations from thymus and liver were stimulated as described in Fig. 1, and ICS was performed after 20 and 72 h. The first group of dot plots shows freshly isolated NKT cells for α-GC/CD1d tetramer and CD4 expression. The second and third groups represent cultured cells at 20 and 72 h, respectively, and depict CD4 versus IL-17. The numbers in each quadrant represent the percentage of total cells, except for stimulated NK1.1 NKT cells, for which the numbers represent the percentage of either CD4+ or CD4 NKT cells producing IL-17. Dot plots are representative of two experiments. (B) NKT cells from thymus and liver were purified into 4 subsets on the basis of NK1.1 and CD4 expression and cultured as described in Fig. 1. Supernatants were harvested at 24 and 72 h to assay for secreted IL-17 by ELISA. Thymus bars represent 8 separate cultures derived over four independent experiments, and liver bars represent 3–5 separate cultures derived over two independent experiments. The 24-h thymus graph contains a split y-axis. (C) NK1.1CD4 and NK1.1CD4+ thymus NKT cells were assayed for intracellular IL-17 expression after 6 h CD3/CD28 stimulation in 1 experiment. Shown is IL-4 versus IL-17 expression in stimulated and nonstimulated samples. Numbers represent the percentage of cells in that quadrant.
Fig. 5.
Fig. 5.
CD4NK1.1 NKT cells are precursors for CD4NK1.1+ NKT cells. (A) E15 fetal thymus lobes were cultured for 1 week in standard FTOC conditions to allow development of CD4+CD8+ thymocytes. Lobes then were added to hanging drop cultures, combined with defined NKT subsets overnight, and returned to standard FTOC conditions for another 7 days before harvesting for analysis by FACS. CFSE labeling or a congenic marker together with α-GC/CD1d tetramer staining was used to identify donor NKT cells, and both doublet exclusion and unloaded tetramer exclusion were used to exclude false positives. Data are representative of 10 separate cultures for CD4+NK1.1 NKT cell repopulations and of 9 CD4NK1.1 NKT cell repopulations derived over three independent experiments. (B) The percentage of mature NKT cell subsets from the given starting population that is present at the end of the culture period. Bars depict mean ± standard error. (C) NKT cells defined as α-GC/CD1d tetramer+ αβTCR+ cells were electronically gated, and NK1.1 and NK1.1+ subsets were examined separately for expression of CD44 versus CD4. Data shown are representative of 5 separate mice for each time point.
Fig. 6.
Fig. 6.
Revised schematic of NKT cell development showing CD4 NKT cells branching at the NK1.1 stage.

References

    1. Godfrey DI, Kronenberg M. Going both ways: Immune regulation via CD1d-dependent NKT cells. J Clin Invest. 2004;114:1379–1388. - PMC - PubMed
    1. Godfrey DI, MacDonald HR, Kronenberg M, Smyth MJ, Van Kaer L. NKT cells: What's in a name? Nat Rev Immunol. 2004;4:231–237. - PubMed
    1. Gumperz JE, Miyake S, Yamamura T, Brenner MB. Functionally distinct subsets of CD1d-restricted natural killer T cells revealed by CD1d tetramer staining. J Exp Med. 2002;195:625–636. - PMC - PubMed
    1. Lee PT, Benlagha K, Teyton L, Bendelac A. Distinct functional lineages of human V(alpha)24 natural killer T cells. J Exp Med. 2002;195:637–641. - PMC - PubMed
    1. Crowe NY, et al. Differential antitumor immunity mediated by NKT cell subsets in vivo. J Exp Med. 2005;202:1279–1288. - PMC - PubMed

Publication types

MeSH terms