

Rapid GIS-based profiling of West Nile virus transmission: defining environmental factors associated with an urban-suburban outbreak in Northeast Ohio, USA
- PMID: 18686270
- PMCID: PMC3140769
- DOI: 10.4081/gh.2008.245
Rapid GIS-based profiling of West Nile virus transmission: defining environmental factors associated with an urban-suburban outbreak in Northeast Ohio, USA
Abstract
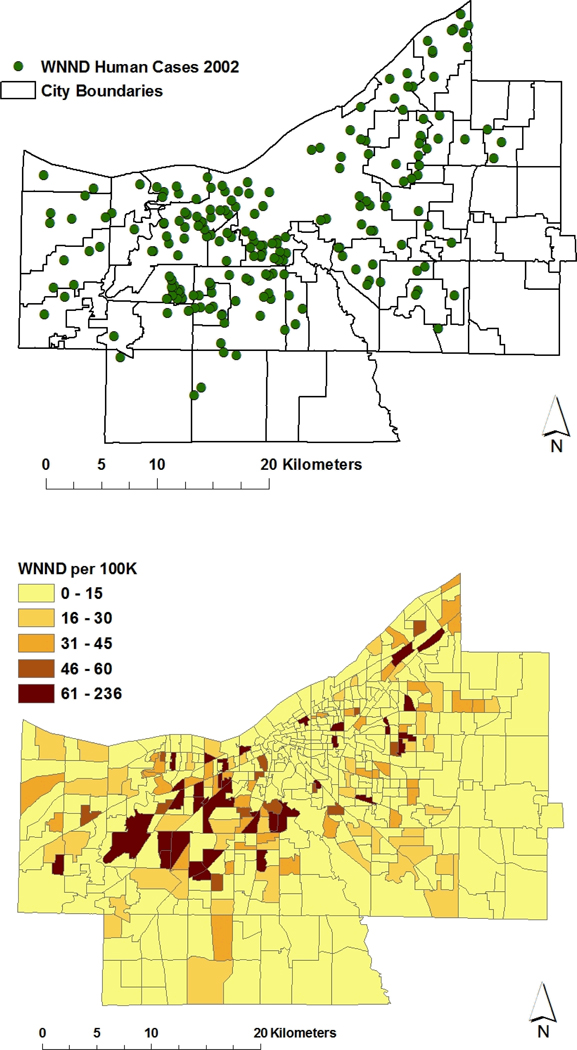
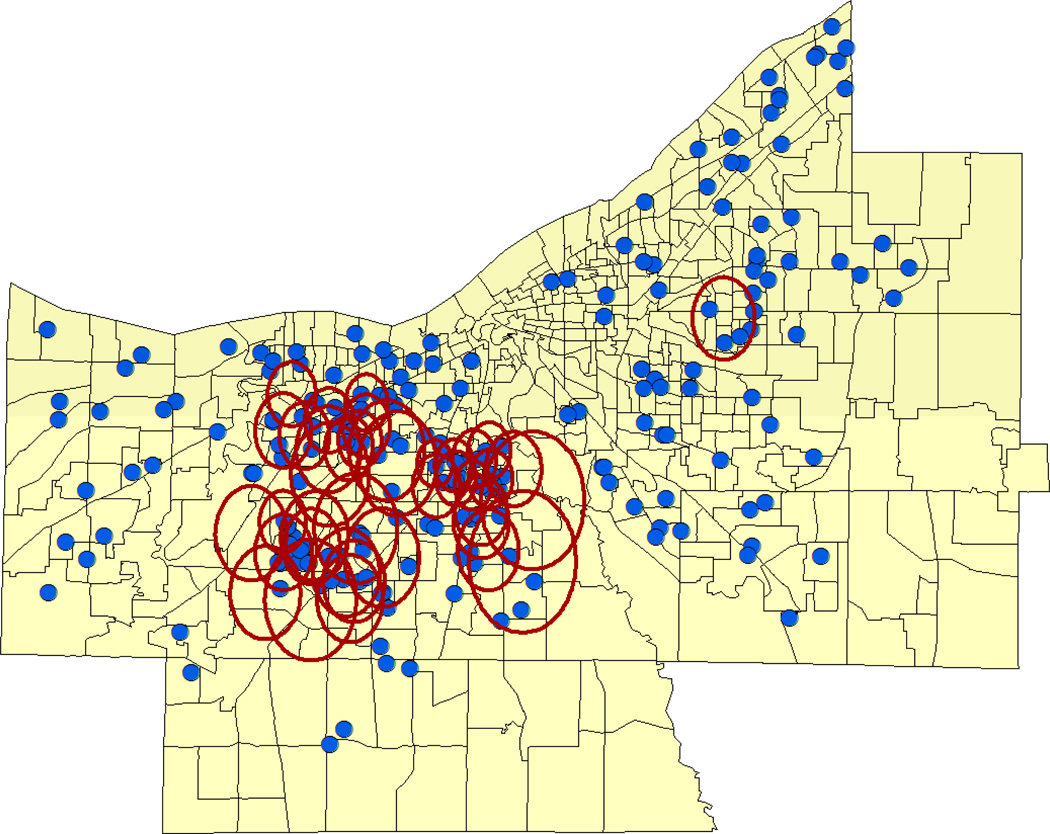
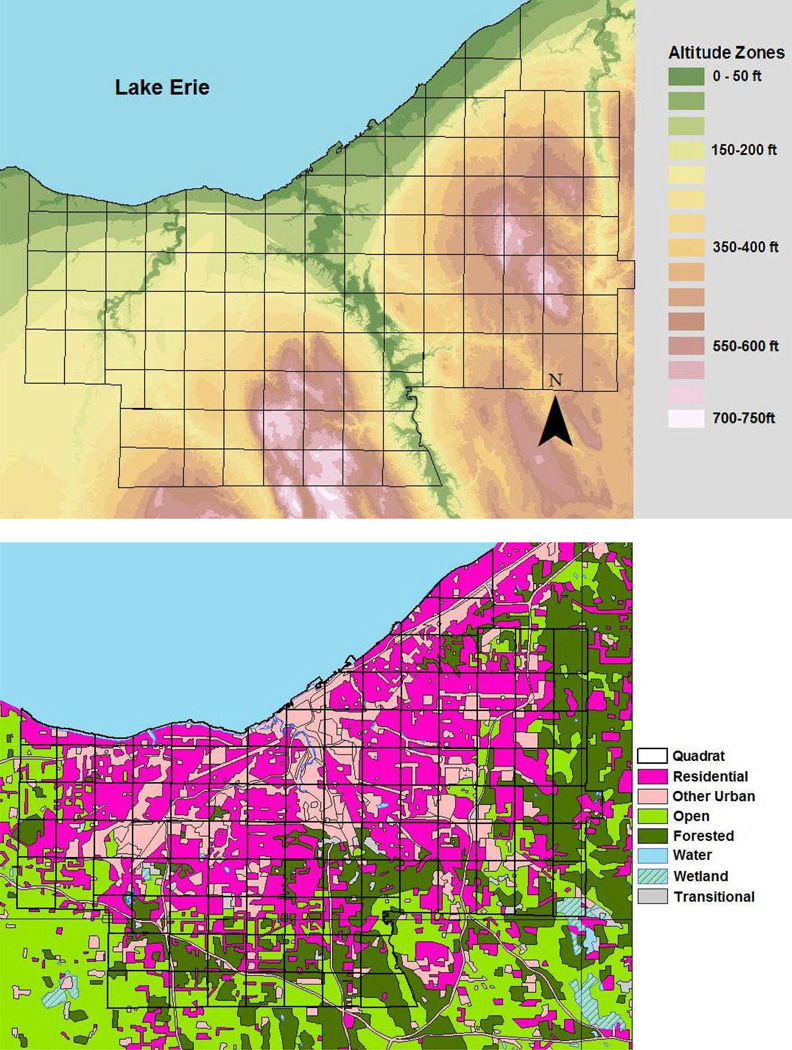
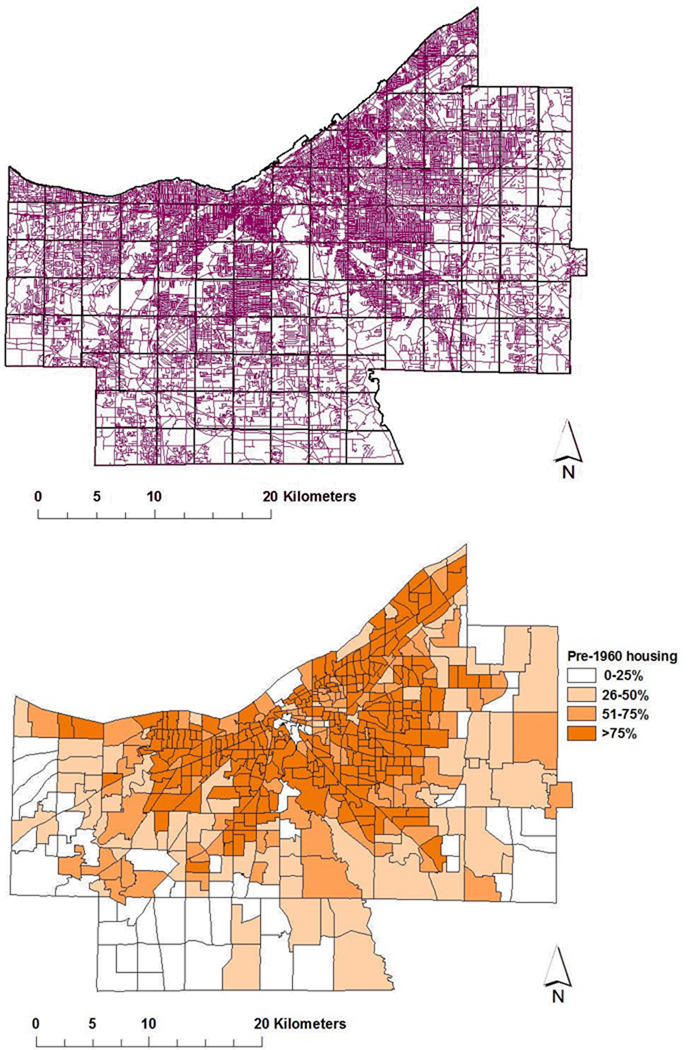
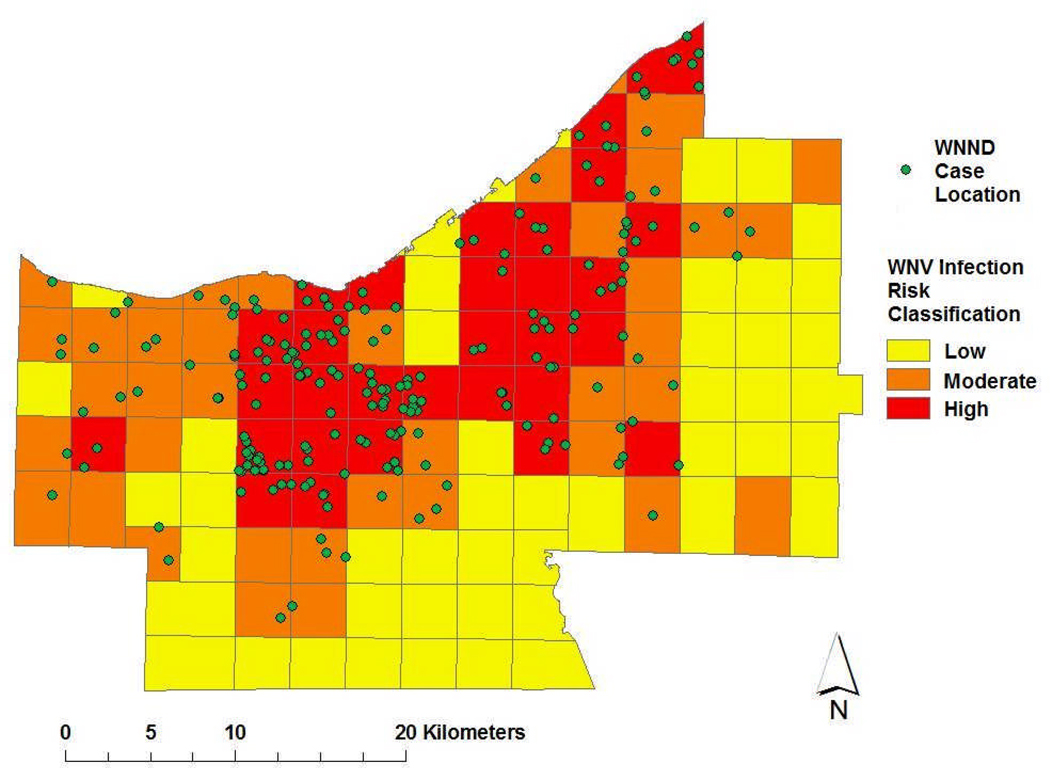
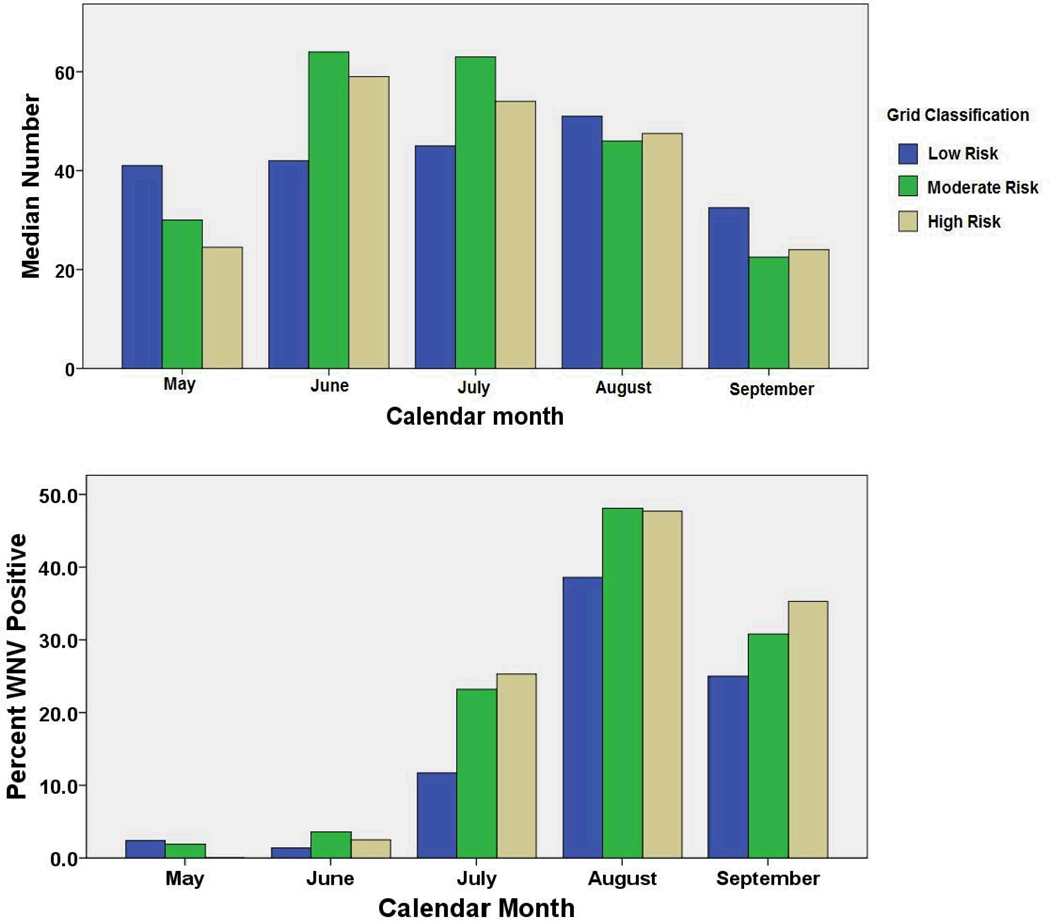
Human West Nile virus (WNV) infection was first detected in Cuyahoga county, Ohio, USA, in 2002. During that year's extensive epidemic/epizootic among non-immune human and bird populations, the county experienced 155 cases of severe human West Nile neurological disease (WNND, incidence = 11.1 cases/100,000), with 11 fatalities. Structured serosurveys indicated that 1.9%, or approximately 26,000 of county residents (population = 1,372,303) were infected that year. In early 2003, in order to better focus monitoring and control efforts, we used a geographical information system (GIS) approach and spatial statistical analysis to identify the association of environmental factors and human population structure with the observed local risk for WNV transmission. Within the varied range of urban/suburban/ rural habitats across the 1186 km2 county, exploratory analysis indicated significant clustering of WNND risk in inner-ring suburbs. Subsequent discriminant factor analysis based on inputs of census and land-use/land cover data was found to effectively classify sub-areas of the county having low, medium and high WNV risk. On a 1036 ha quadrat scale of resolution, higher risk of human infection was significantly associated with higher-income areas, increased fractionation of habitat and older housing, while it was negatively associated with areas of agricultural land, wetland or forest. The areal classification of WNV transmission risk has been validated over time through detection of increased local Culex spp. mosquito density (2002-2006), and increased frequency of WNV positive mosquito pools within the medium- and high-risk quadrats. This timely working identification of the transmission scale effectively focused control interventions against newly invasive WNV in a complex North American habitat.
Figures
References
-
- Blair RB. Land use and avian species diversity along an urban gradient. Ecological Applications. 1996;6:506–519.
-
- CDC. Outbreak of West Nile-like viral encephalitis--New York, 1999. MMWR Morb Mortal Wkly Rep. 1999;48:845–849. - PubMed
-
- CDC. West Nile virus activity--United States, September 12–18, 2002, and Ohio, January 1-September 12, 2002. MMWR Morb Mortal Wkly Rep. 2002;51:836–837. - PubMed
-
- Dye C. Vectorial Capacity: Must we measure all its components? Parasitology Today. 1986;2:203–209. - PubMed
-
- Dye C. Approaches to vector control: The epidemiological context of vector control. Trans R Soc Trop Med Hyg. 1994;88:147–149. - PubMed
Publication types
MeSH terms
Grants and funding
LinkOut - more resources
Full Text Sources
Medical
Miscellaneous