

Image processing and analysis for quantifying gene expression from early Drosophila embryos
- PMID: 18687054
- PMCID: PMC2630463
- DOI: 10.1089/ten.tea.2008.0202
Image processing and analysis for quantifying gene expression from early Drosophila embryos
Abstract
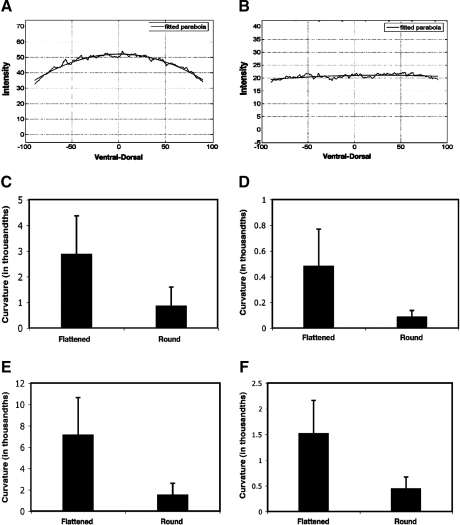
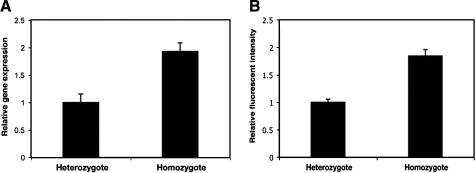
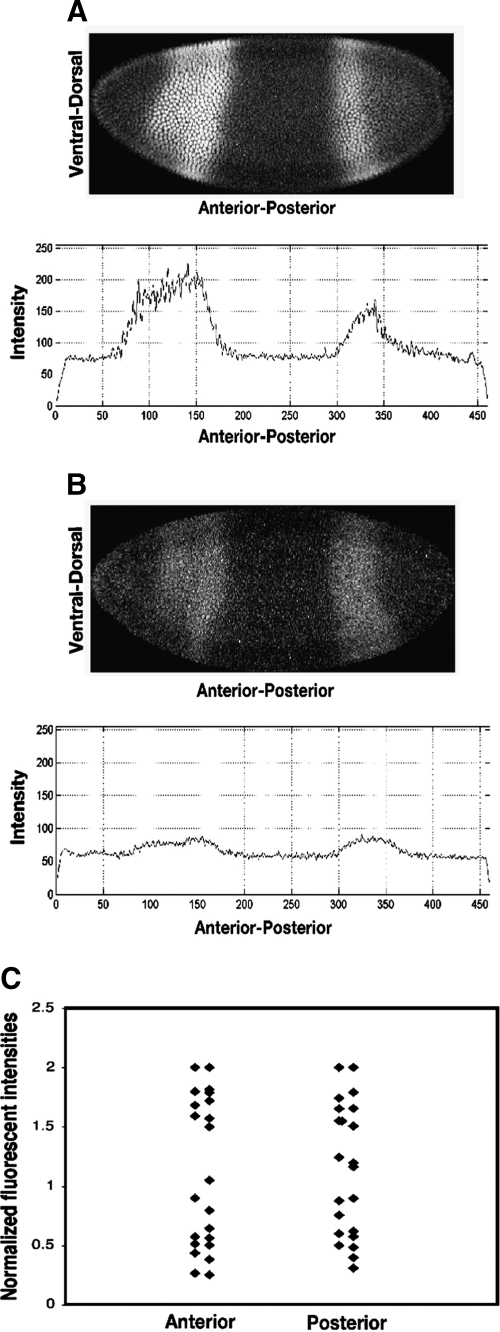
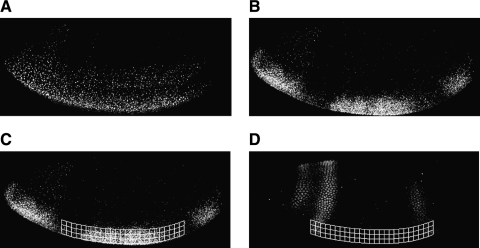
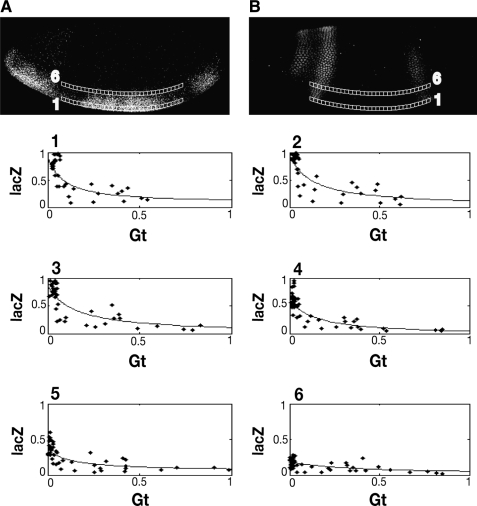
Correlation of quantities of transcriptional activators and repressors with the mRNA output of target genes is a central issue for modeling gene regulation. In multicellular organisms, both spatial and temporal differences in gene expression must be taken into account; this can be achieved by use of in situ hybridization followed by confocal laser scanning microscopy (CLSM). Here we present a method to correlate the protein levels of the short-range repressor Giant with lacZ mRNA produced by reporter genes using images of Drosophila blastoderm embryos taken by CLSM. The image stacks from CLSM are processed using a semiautomatic algorithm to produce correlations between the repressor levels and lacZ mRNA reporter genes. We show that signals derived from CLSM are proportional to actual mRNA levels. Our analysis reveals that a suggested parabolic form of the background fluorescence in confocal images of early Drosophila embryos is evident most prominently in flattened specimens, with intact embryos exhibiting a more linear background. The data extraction described in this paper is primarily conceived for analysis of synthetic reporter genes that are designed to decipher cis-regulatory grammar, but the techniques are generalizable for quantitative analysis of other engineered or endogenous genes in embryos.
Figures
Similar articles
-
A high-throughput method for quantifying gene expression data from early Drosophila embryos.Dev Genes Evol. 2005 Jul;215(7):374-81. doi: 10.1007/s00427-005-0484-y. Epub 2005 Apr 15. Dev Genes Evol. 2005. PMID: 15834586
-
Live Imaging of mRNA Transcription in Drosophila Embryos.Methods Mol Biol. 2018;1863:165-182. doi: 10.1007/978-1-4939-8772-6_10. Methods Mol Biol. 2018. PMID: 30324598
-
Quantitative analysis reveals genotype- and domain- specific differences between mRNA and protein expression of segmentation genes in Drosophila.Dev Biol. 2019 Apr 1;448(1):48-58. doi: 10.1016/j.ydbio.2019.01.006. Epub 2019 Jan 7. Dev Biol. 2019. PMID: 30629954 Free PMC article.
-
[Methods for acquisition of quantitative from confocal images of gene expression in situ].Tsitologiia. 2008;50(4):352-69. Tsitologiia. 2008. PMID: 18664119 Review. Russian.
-
The mother-to-child transition.Dev Cell. 2007 Jun;12(6):847-9. doi: 10.1016/j.devcel.2007.05.009. Dev Cell. 2007. PMID: 17543857 Review.
Cited by
-
Deciphering a transcriptional regulatory code: modeling short-range repression in the Drosophila embryo.Mol Syst Biol. 2010;6:341. doi: 10.1038/msb.2009.97. Epub 2010 Jan 19. Mol Syst Biol. 2010. PMID: 20087339 Free PMC article.
-
Quantitative perturbation-based analysis of gene expression predicts enhancer activity in early Drosophila embryo.Elife. 2016 May 6;5:e08445. doi: 10.7554/eLife.08445. Elife. 2016. PMID: 27152947 Free PMC article.
-
Conserved catalytic and C-terminal regulatory domains of the C-terminal binding protein corepressor fine-tune the transcriptional response in development.Mol Cell Biol. 2011 Jan;31(2):375-84. doi: 10.1128/MCB.00772-10. Epub 2010 Nov 15. Mol Cell Biol. 2011. PMID: 21078873 Free PMC article.
-
Medium-throughput processing of whole mount in situ hybridisation experiments into gene expression domains.PLoS One. 2012;7(9):e46658. doi: 10.1371/journal.pone.0046658. Epub 2012 Sep 28. PLoS One. 2012. PMID: 23029561 Free PMC article.
-
Optimization of reporter gene architecture for quantitative measurements of gene expression in the Drosophila embryo.Fly (Austin). 2011 Jan-Mar;5(1):47-52. doi: 10.4161/fly.5.1.14159. Epub 2011 Jan 1. Fly (Austin). 2011. PMID: 21150286 Free PMC article.
References
-
- Jaeger J.Surkova S.Blagov M.Janssens H.Kosman D.Kozlov K.N. Manu, Myasnikova E.Vanario-Alonso C.E.Samsonova M.Sharp D.H.Reinitz J.Dynamic control of positional information in the early Drosophila blastoderm Nature 430368.2004. - PubMed
-
- Zinzen R.P. Senger K. Levine M. Papatsenko D. Computational models for neurogenic gene expression in the Drosophila embryo. Curr Biol. 2006;16:1358. - PubMed
-
- Rivera-Pomar R. Jackle H. From gradients to stripes in Drosophila embryogenesis: filling in the gaps. Trends Genet. 1996;12:478. - PubMed
-
- Janssens H. Hou S. Jaeger J. Kim A.-R. Myasnikova E. Sharp D. Reinitz J. Quantitative and predictive model of transcriptional control of the Drosophila melanogaster even skipped gene. Nat Genet. 2006;38:1159. - PubMed
-
- Segal E. Raveh-Sadka T. Schroeder M. Unnerstall U. Gaul U. Predicting expression patterns from regulatory sequence in Drosophila segmentation. Nature. 2008;451:535. - PubMed
Publication types
MeSH terms
Substances
Grants and funding
LinkOut - more resources
Full Text Sources
Molecular Biology Databases
