. 2009 Feb;27(2):222-32.
doi: 10.1016/j.mri.2008.06.009. Epub 2008 Aug 6.

On the voxel size and magnetic field strength dependence of spectral resolution in magnetic resonance spectroscopy

Affiliations

On the voxel size and magnetic field strength dependence of spectral resolution in magnetic resonance spectroscopy

Roman Fleysher et al. Magn Reson Imaging. 2009 Feb.

Abstract

While the inherent low sensitivity of in vivo MR spectroscopy motivated a trend towards higher magnetic fields, B(0), it has since become apparent that this increase does not seem to translate into the anticipated improvement in spectral resolution. This is attributed to the decrease of the transverse relaxation time, T(2)*, in vivo due to macro- and mesoscopic tissue susceptibility. Using spectral contrast-to-noise ratio (SCNR) arguments, we show that if in biological systems the linewidth (on the frequency scale) increases linearly with the field, the spectral resolution (in parts per million) improves approximately as the fifth-root of B(0) for chemically shifted lines and decreases as about B(0)(4/5) (in hertz) for a structure of J-coupled multiplets. It is also shown that for any given B(0) there is a unique voxel size that is optimal in spectral resolution, linking the spectral and spatial resolutions. Since in practical applications the spatial resolution may be dictated by the target anatomy, nomograms to determine the B(0) required to achieve the desired spectral resolution at that voxel size are presented. More generally, the scaling of the nomograms to determine the achievable spectral and spatial resolutions at any given field is described.


Figures
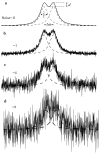
Fig. 1
Fig. 1
Two underlying Lorentzian peaks (dashed lines) forming a saddle in the resultant spectrum (solid line) are resolved when the saddle can be distinguished from noise fluctuations. As the noise increases to 1, 4, and 9 in b, c, and d, the saddle gets obscured which diminishes the ability to resolve the individual lines of the pair demonstrating the linkage between resolution and the noise.
Fig. 2
Fig. 2
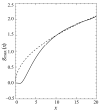
The function gmax(x) of Eq. [9]. When the peak separation in units of half-width, x, is small, gmax(x) is negative indicating that no valley is formed. For comparison, the dashed line represents x/4.5 dependence showing that at large separations gmax(x) approaches the square root.
Fig. 3
Fig. 3
In vivo full width at half maximum (in Hz) of 1H peaks of the main brain metabolites versus field strength (in Tesla) measured using fixed, h=1cm, voxel size. (Adopted from (11), Fig. 9a.) The straight lines present linear fits with intercepts of 1.82, 2.07, 1.28 Hz and slopes of 1.02, 1.06, 1.17 Hz/T for NAA, creatine and choline respectively.
Fig. 4
Fig. 4
In vivo full width at half maximum (in Hz) of the creatine peak versus voxel size (in cm) at fixed, 3 Tesla, field strength. (Adopted from (30), Table 2.) The straight line presents a linear fit with the intercept of 0.74 Hz and the slope of 5.26 Hz/cm.
Fig. 5
Fig. 5
a: Contour plot of the spectral resolution ΔΩ=Δωτ (dimensionless analogue of frequency in Hz) as a function of static field, b0=χτB0, and voxel size, H=κh/χ, for components of J-coupled doublets in dimensionless units. b: Dependence of the spectral resolution on magnetic field strength, for a fixed, H=2.1, voxel size (section through the contour plot a at H=2.1). For comparison, the dashed line represents the b00.7 dependence. c: Dependence of the spectral resolution on voxel size for a fixed b0=1.01 (section of contour plot a at b0=1.01). Note the presence of an optimal voxel size for the field (marked with the arrow). Note, that to transform the dimensionless analogue of frequency ΔΩ/2π to the physical frequency in Hz, the value of ΔΩ/2π is to be divided by the value of the tissue specific parameter τ. The voxel size in cm is related to the dimensionless H through h=χH/κ and the field strength in Tesla through B0=b0/χτ.
Fig. 6
Fig. 6
a: Contour plot of the spectral resolution ΔΓ=Δγ/χ (the dimensionless analogue of the chemical shift in ppm) as a function of static field, b0=χτB0, and voxel size, H=κh/χ, for chemically shifted spin systems in dimensionless units. b: Dependence of the spectral resolution on magnetic field strength for a fixed, H=2.1, voxel size (section through the contour plot aat H=2.1). For comparison, the dashed line represents the b0-0.3 dependence. c: Dependence of the spectral resolution on voxel size for a fixed b0=1.01 (section of contour plot a at b0=1.01). Note the presence of an optimal voxel size for the field (marked with the arrow). Note, that the dimensionless analogue of chemical shift distance ΔΓ is transformed to Δγ in ppm by multiplying it with a tissue specific χ. The voxel size in cm is related to the dimensionless H through h=χH/κ and the field strength in Tesla through B0=b0/τ.
Fig. 7
Fig. 7
a: Optimal voxel size as a function of b0 from 0.3 to 10. b: Spectral resolution of chemically shifted spin systems as a function of b0 assuming optimal voxel size, compared with b0-1/5 dependence (dashed line). Note that improvement in spectral resolution is much slower than linear in b0. c: Spectral resolution of J-coupled spin systems as a function of b0 for an optimal voxel size. For comparison, the dashed line represents a b04/5 dependence. Note that resolution deteriorates slightly slower than linear in b0.
Fig. 8
Fig. 8
Same as Fig. 7 but assuming the most optimistic (for spectroscopic resolution) case when T1 does not depend on B0 (α=0). The general behavior is the same as in Fig. 7.

Similar articles

Cited by

References

    1. Gruetter R, Weisdorf SA, Rajanayagan V, Terpstra M, Merkle H, Truwit CL, Garwood M, Nyberg SL, Ugurbil K. Resolution improvements in in vivo 1H NMR spectra with increased magnetic field strength. J Magn Reson. 1998;135:260–264. - PubMed
    1. Gonen O, Gruber S, Li BS, Mlynarik V, Moser E. Multivoxel 3D proton spectroscopy in the brain at 1.5 versus 3.0 T: signal-to-noise ratio and resolution comparison. AJNR Am J Neuroradiol. 2001;22:1727–1731. - PMC - PubMed
    1. Barker PB, Hearshen DO, Boska MD. Single-voxel proton MRS of the human brain at 1.5 T and 3.0 T. Magn Reson Med. 2001;45:765–769. - PubMed
    1. Thulborn KR. Why neuroradiologists should consider very-high-field magnets for clinical applications of functional magnetic resonance imaging. Top Magn Reson Imaging. 1999;10:1–2. - PubMed
    1. Ugurbil K, Adriany G, Andersen P, Chen W, Garwood M, Gruetter R, Henry PG, Kim SG, Lieu H, Tkac I, Vaughan T, Van De Moortele PF, Yacoub E, Zhu XH. Ultrahigh field magnetic resonance imaging and spectroscopy. Magn Reson Imaging. 2003;21:1263–1281. - PubMed

Publication types