

Measurement characteristics of the ankle-brachial index: results from the Action for Health in Diabetes study
- PMID: 18687759
- PMCID: PMC2713116
- DOI: 10.1177/1358863X08091338
Measurement characteristics of the ankle-brachial index: results from the Action for Health in Diabetes study
Abstract
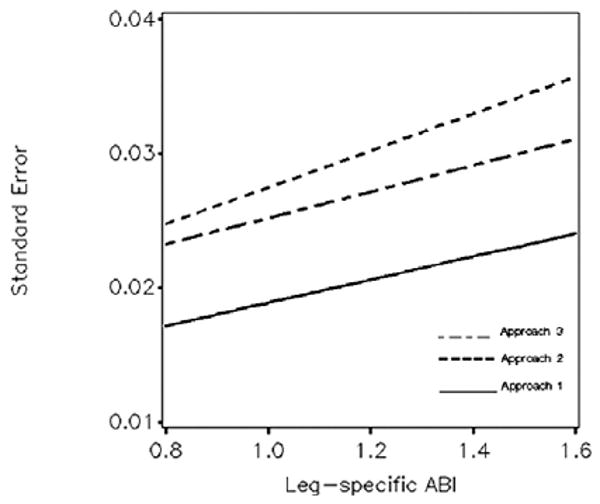
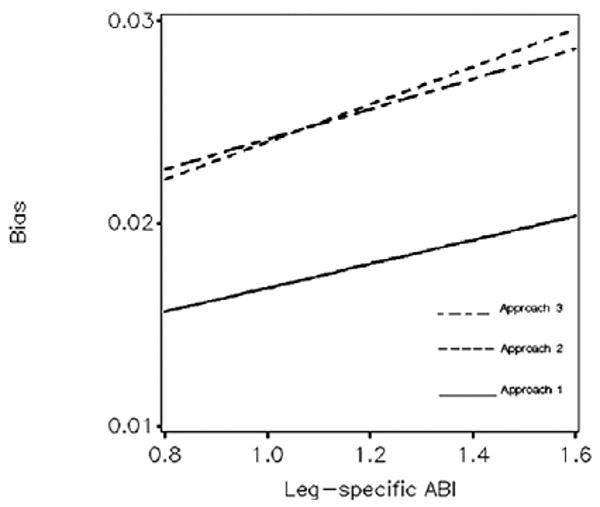
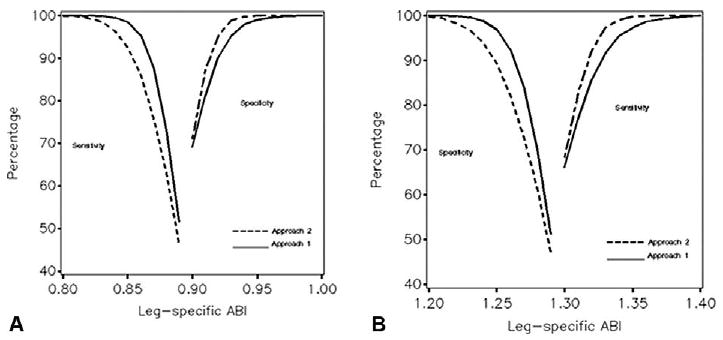
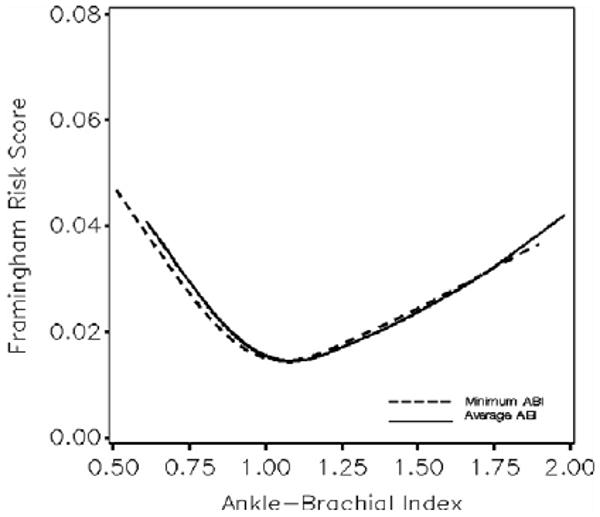
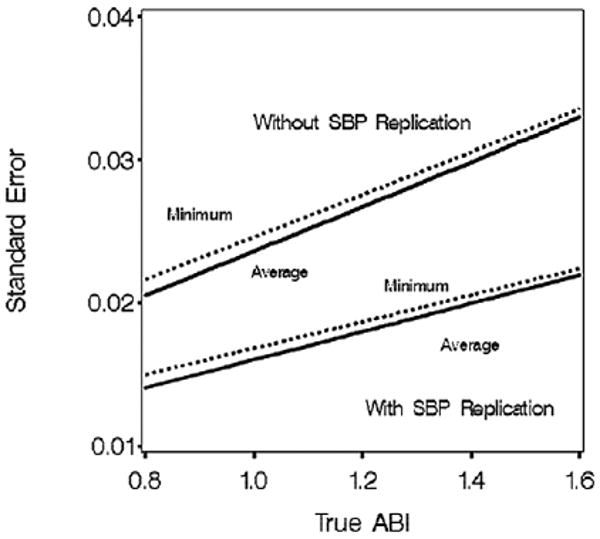
Many protocols have been used in clinical and research settings for collecting systolic blood pressure (SBP) measurements to calculate the ankle-brachial index (ABI); however, it is not known how useful it is to replicate measurements and which measures best reflect cardiovascular risk. Standardized measurements of ankle and arm SBP from 5140 overweight or obese individuals with type 2 diabetes were used to estimate sources of variation. Measurement characteristics of leg-specific ABI, as calculated using a standard algorithm based on the highest SBP of the dorsalis pedis or posterior tibial arteries, were projected using simulations. Coefficients of variability ranged from 2% to 3% when single SBP measurements were used and ABI was overestimated by 2-3%. Taking two SBP measurements at each site reduced standard errors and bias each by 30-40%. The sensitivity of detecting low ABI ranges exceeded 90% for ABI within 0.05 of the 0.90 clinical cut-point. The average and the minimum of the two (i.e. right and left) leg-specific ABI values had similar U-shaped relationships with Framingham risk scores; however, the average leg ABI had slightly greater precision. Replicating SBP measurements reduces the error and bias of ABI. Averaging leg-specific values may increase power for characterizing cardiovascular disease risk.
Trial registration: ClinicalTrials.gov NCT00017953.
Conflict of interest statement
Figures
References
-
- Hiatt WR, Hoag S, Hamman RF. Effect of diagnostic criteria on the prevalence of peripheral arterial disease: The San Luis Valley Diabetes Study. Circulation. 1995;91:1472–1479. - PubMed
-
- Greenland P, Abrams J, Aurigemma GP, et al. Beyond secondary prevention: identifying the high-risk patient for primary prevention: noninvasive tests of atherosclerotic burden. Circulation. 2000;101:e16–e222. - PubMed
-
- Hiatt WR. Medical treatment of peripheral arterial disease and claudication. N Engl J Med. 2001;344:1608–1621. - PubMed
-
- Murabito JM, Evans JC, Larson MG, Nieto K, Levy D, Wilson PWF. The ankle–brachial index in the elderly and risk of stroke, coronary disease, and death. The Framingham Study. Arch Intern Med. 2003;163:1939–1942. - PubMed
-
- Resnick HE, Lindsay RS, McDermott MM, et al. Relationship of high and low ankle brachial index to all-cause and cardiovascular disease mortality: the Strong Heart Study. Circulation. 2004;109:733–739. - PubMed
Publication types
MeSH terms
Associated data
Grants and funding
- U01 DK057151/DK/NIDDK NIH HHS/United States
- DK57151/DK/NIDDK NIH HHS/United States
- U01 DK057154/DK/NIDDK NIH HHS/United States
- U01 DK057171/DK/NIDDK NIH HHS/United States
- DK57182/DK/NIDDK NIH HHS/United States
- DK57002/DK/NIDDK NIH HHS/United States
- U01 DK057182/DK/NIDDK NIH HHS/United States
- U01 DK057002/DK/NIDDK NIH HHS/United States
- U01 DK057177/DK/NIDDK NIH HHS/United States
- M01 RR001066/RR/NCRR NIH HHS/United States
- U01 DK057078/DK/NIDDK NIH HHS/United States
- Z01 DK069036/ImNIH/Intramural NIH HHS/United States
- DK57008/DK/NIDDK NIH HHS/United States
- DK56992/DK/NIDDK NIH HHS/United States
- DK57078/DK/NIDDK NIH HHS/United States
- M01RR00211-40/RR/NCRR NIH HHS/United States
- P30 DK048520/DK/NIDDK NIH HHS/United States
- U01 DK057135/DK/NIDDK NIH HHS/United States
- P30 DK046204/DK/NIDDK NIH HHS/United States
- DK57171/DK/NIDDK NIH HHS/United States
- M01 RR002719/RR/NCRR NIH HHS/United States
- DK57131/DK/NIDDK NIH HHS/United States
- M01 RR000056/RR/NCRR NIH HHS/United States
- U01 DK057219/DK/NIDDK NIH HHS/United States
- DK57149/DK/NIDDK NIH HHS/United States
- U01 DK056992/DK/NIDDK NIH HHS/United States
- M01-RR-02719/RR/NCRR NIH HHS/United States
- U01 DK057136/DK/NIDDK NIH HHS/United States
- DK57178/DK/NIDDK NIH HHS/United States
- M01 RR000211/RR/NCRR NIH HHS/United States
- P30 DK48520/DK/NIDDK NIH HHS/United States
- U01 DK057131/DK/NIDDK NIH HHS/United States
- M01 RR000051/RR/NCRR NIH HHS/United States
- M01RR000056 44/RR/NCRR NIH HHS/United States
- DK57136/DK/NIDDK NIH HHS/United States
- DK57154/DK/NIDDK NIH HHS/United States
- DK57219/DK/NIDDK NIH HHS/United States
- DK57177/DK/NIDDK NIH HHS/United States
- U01 DK056990/DK/NIDDK NIH HHS/United States
- U01 DK057178/DK/NIDDK NIH HHS/United States
- U01 DK057008/DK/NIDDK NIH HHS/United States
- DK56990/DK/NIDDK NIH HHS/United States
- DK 046204/DK/NIDDK NIH HHS/United States
- M01-RR-01066/RR/NCRR NIH HHS/United States
- U01 DK057149/DK/NIDDK NIH HHS/United States
- M01-RR-00051/RR/NCRR NIH HHS/United States
- DK57135/DK/NIDDK NIH HHS/United States
LinkOut - more resources
Full Text Sources
Medical
