. 2008 Dec;149(12):6053-64.
doi: 10.1210/en.2008-0775. Epub 2008 Aug 7.

Deficiency of TNFalpha converting enzyme (TACE/ADAM17) causes a lean, hypermetabolic phenotype in mice

Affiliations

Deficiency of TNFalpha converting enzyme (TACE/ADAM17) causes a lean, hypermetabolic phenotype in mice

Richard W Gelling et al. Endocrinology. 2008 Dec.

Abstract

Energy homeostasis involves central nervous system integration of afferent inputs that coordinately regulate food intake and energy expenditure. Here, we report that adult homozygous TNFalpha converting enzyme (TACE)-deficient mice exhibit one of the most dramatic examples of hypermetabolism yet reported in a rodent system. Because this effect is not matched by increased food intake, mice lacking TACE exhibit a lean phenotype. In the hypothalamus of these mice, neurons in the arcuate nucleus exhibit intact responses to reduced fat mass and low circulating leptin levels, suggesting that defects in other components of the energy homeostasis system explain the phenotype of Tace(DeltaZn/DeltaZn) mice. Elevated levels of uncoupling protein-1 in brown adipose tissue from Tace(DeltaZn/DeltaZn) mice when compared with weight-matched controls suggest that deficient TACE activity is linked to increased sympathetic outflow. These findings collectively identify a novel and potentially important role for TACE in energy homeostasis.


Figures

Figure 1
Figure 1
TaceΔZnZn mice have reduced fat mass despite normal food intake. QMR measurements were performed on 12- to 14-wk-old male TaceΔZnZn, WT, and WT-CR mice. A, Body weight (***, WT vs. TaceΔZnZn, P < 0.001; **, WT vs. WT-CR; #, TaceΔZnZn vs. WT-CR, P < 0.01). B, Leptin plasma levels (*, WT vs. TaceΔZnZn, P < 0.05). C, Fat mass (***, WT vs. TaceΔZnZn, P < 0.001; *, WT vs. WT-CR, P < 0.05). D, Lean mass (***, WT vs. TaceΔZnZn, P < 0.001; *, WT vs. WT-CR, P < 0.05). E, Fat mass as a percentage of total body weight (*, WT vs. TaceΔZnZn, P < 0.05). F, Lean mass as a percentage of total body weight. G, Food intake was measured as described in experimental procedures. In panels, data are presented as mean ± sem. For A, C, D, E, and F, n = 10–14; B, n = 4–10; G, n = 4–5.
Figure 2
Figure 2
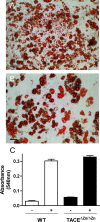
MEFs from TaceΔZnZn mice are not defective in adipocyte differentiation. Primary MEFs derived from wild-type (A) and TaceΔZnZn (B) 14.5-d-old embryos were treated with differentiation mixture (DM) as described under experimental procedures. At d 8 after induction, cells were stained for lipid droplets with Oil Red O. C, Quantification of neutral lipid (Oil Red O) accumulation during adipocyte differentiation from wild-type and TaceΔZnZn MEFs treated at d 8 after induction with or without DM. Data are presented as mean ± sem from triplicate cultures. Scale, 40 μm.
Figure 3
Figure 3
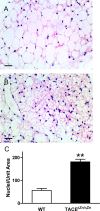
WAT from TaceΔZnZn mice exhibits a multilocular appearance and increased cellularity. Paraffin-embedded sections of gonadal WAT from wild-type (A) and TaceΔZnZn (B) littermates stained with H&E. WAT from TaceΔZnZn mice showed a multilocular appearance with increased eosin staining. C, Quantitation of the number of adipocytes and nuclei within WAT H&E sections. At least three fields were evaluated per fat pad. Data are presented as mean ± sem (n = 5). Differences between WT and TaceΔZnZn mice were evaluated with Student’s t test. **, P < 0.001. Scale, 10 μm.
Figure 4
Figure 4
TaceΔZnZn mice have dramatically increased energy expenditure. A, VO2 in WT, TaceΔZnZn, and WT-CR mice. Arrows indicate when WT-CR mice were given access to food as described in experimental procedures. B, Mean VO2 consumption during dark and light cycles (***, WT vs. TaceΔZnZn; ###, TaceΔZnZn vs. WT-CR; **, WT vs. WT-CR, P < 0.001). C, Mean RER during dark and light cycles (*, WT vs. WT-CR and TaceΔZnZn vs. WT-CR, P < 0.05). D, Mean ambulatory activity during dark and light cycles (**, WT vs. TaceΔZnZn and WT vs. WT-CR, P < 0.01). E, Mean VO2 consumption at thermoneutrality in the dark cycle (***, WT vs. TaceΔZnZn, P < 0.001). F, Mean VO2 consumption at thermoneutrality in the light cycle (***, WT vs. TaceΔZnZn, P < 0.001). All values are given as mean ± sem (n = 4–10/group).
Figure 5
Figure 5
BAT from TaceΔZnZn mice exhibits increased cellularity and UCP-1 protein levels. Paraffin-embedded sections of BAT from WT (A) and TaceΔZnZn (B) littermates stained with H&E. BAT from TaceΔZnZn mice showed increased eosin staining. C, Calculation of the number of adipocyte nuclei within BAT H&E sections. At least three fields were evaluated per fat pad. Data are presented as mean ± sem (n = 4–5). Differences between WT and TaceΔZnZn mice were evaluated with Student’s t test (**, P < 0.05). Scale, 10 μm. D, A representative example of Western blot analysis for UCP-1 expression in protein extracts of BAT obtained from TaceΔZnZn and sex-matched WT control mice. β-Actin was used a protein loading control.
Figure 6
Figure 6
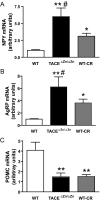
TaceΔZnZn mice display appropriate neuropeptide expression within the ARC of the hypothalamus. Neuropeptide gene expression in the ARC from WT, TaceΔZnZn and WT-CR littermates was examined by real-time PCR. A, NPY mRNA levels (**, WT vs. TaceΔZnZn, P < 0.001; *, WT vs. WT-CR; #, TaceΔZnZn vs. WT-CR, P < 0.05). B, Agouti-related peptide (AgRP) mRNA levels (**, WT vs. TaceΔZnZn, P < 0.001; *, WT vs. WT-CR; #, TaceΔZnZn vs. WT-CR, P < 0.05). C, Proopiomelanocortin (POMC) mRNA levels (**, WT vs. TaceΔZnZn and WT vs. WT-CR, P < 0.01). All values are given as mean ± sem (n = 5–7/group).

References

    1. Seals DF, Courtneidge SA 2003 The ADAMs family of metalloproteases: multidomain proteins with multiple functions. Genes Dev 17:7–30 - PubMed
    1. Blobel CP 2005 ADAMS: key components in EGFR signalling and development. Nat Rev Mol Cell Biol 6:32–43 - PubMed
    1. Ohtsu H, Dempsey PJ, Eguchi S 2006 ADAMs as mediators of EGF receptor transactivation by G protein-coupled receptors. Am J Physiol Cell Physiol 291:C1–C10 - PubMed
    1. Black RA, Rauch CT, Kozlosky CJ, Peschon JJ, Slack JL, Wolfson MF, Castner BJ, Stocking KL, Reddy P, Srinivasan S, Nelson N, Boiani N, Schooley KA, Gerhart M, Davis R, Fitzner JN, Johnson RS, Paxton RJ, March CJ, Cerretti DP 1997 A metalloproteinase disintegrin that releases tumour-necrosis factor-α from cells. Nature 385:729–733 - PubMed
    1. Moss ML, Jin SL, Becherer JD, Bickett DM, Burkhart W, Chen WJ, Hassler D, Leesnitzer MT, McGeehan G, Milla M, Moyer M, Rocque W, Seaton T, Schoenen F, Warner J, Willard D 1997 Structural features and biochemical properties of TNF-α converting enzyme (TACE). J Neuroimmunol 72:127–129 - PubMed

Publication types

MeSH terms